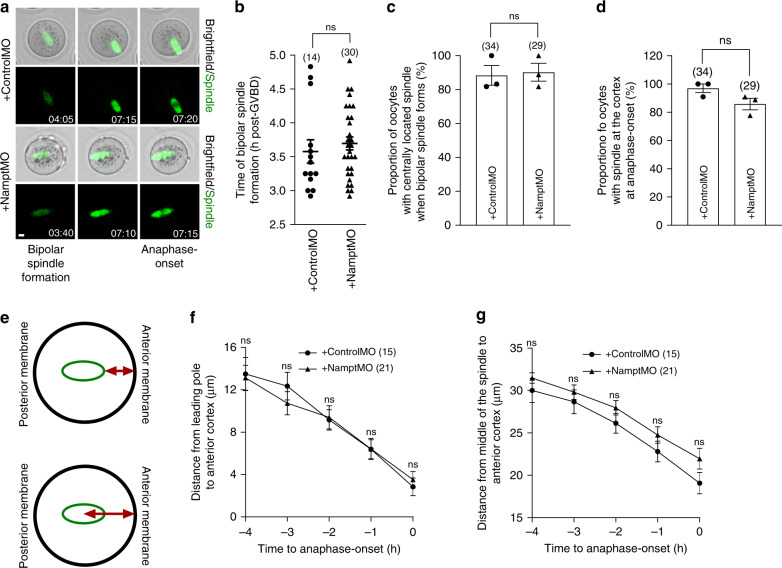
Fig. 2. Intact pre-anaphase-spindle migration following Nampt-depletion.
a Shown are panels comprised of selected brightfield and fluorescence frames from representative time-lapse series of oocytes with SiR-tubulin-labelled spindles. Note that in both ControlMO- and NamptMO-injected oocytes, the bipolar spindle is located close to the oocyte centre when first formed and then migrates to the cortex prior to anaphase-onset. Times are shown as h:min relative to GVBD. Scale bar, 10 μm. Representative images from three independent experiments are shown. b Timing of bipolar spindle formation. c Proportion of oocytes with spindles located in the centre at the time of bipolar spindle formation. d Proportion of oocytes with spindles at the cortex when anaphase occurred. e Schematics depicting the measurements that were plotted in f and g. f Changes in leading pole-to-cortex distance over time. g Changes in spindle centre-to-cortex distance over time. Oocyte numbers are shown in parenthesis from three independent experiments (b–d, f and g). Data in graphs are presented as the mean ± SEM. Data points are shown in c and d. P-values, ns denoted P > 0.05. Statistical comparisons were made using either two-tailed Student’s t-test in b–d or two-way repeated measures ANOVA in f and g. See also Supplementary Movies 2 and 3. Source data are provided as a Source Data file.

