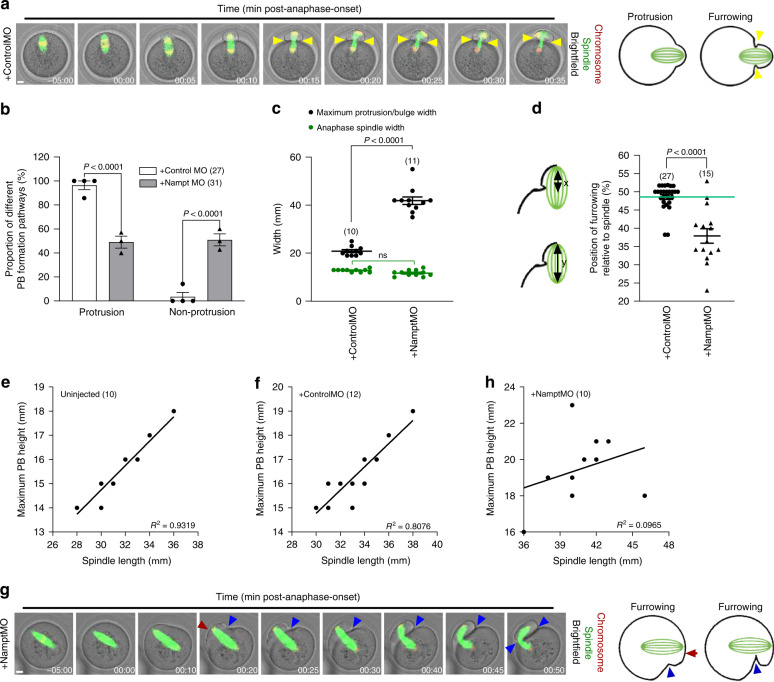
Fig. 5. Characteristics of protrusion and non-protrusion pathways.
a Shown is a panel comprised of selected frames from representative time-lapse series of mock-depleted oocytes with SiR-tubulin-labelled spindles and expressing H2B-RFP to label chromosomes. Yellow arrowheads highlight the position of symmetrical furrowing occurring at the base of the protrusion in a control. Shown to the right is a schematic of the protrusion pathway. Scale bar, 10 µm. Representative images from three independent experiments are shown. b Proportions of mock- and Nampt-depleted oocytes which undergo protrusion- and non-protrusion pathways for PB formation. c Spindle widths and maximum protrusion/bulge widths. d Position of furrowing along the length of the spindle. The distance between the leading pole and the position along the spindle that is abutted by the ingressing furrow (x) was expressed as a percentage of the total spindle length (y) in mock-depleted and Nampt-depleted oocytes as illustrated in the schematic. Green line, highlights the mean value for mock-depleted oocytes. e–h Correlation between maximum PB height and spindle length in uninjected (e), mock-depleted (f) and Nampt-depleted oocytes (h). g Shown is a panel comprised of selected frames from representative time-lapse series of Nampt-depleted oocytes with SiR-tubulin-labelled spindles and expressing H2B-RFP to label chromosomes. Blue arrowhead highlights unilateral furrowing in the absence of a clear protrusion. Red arrowhead highlights the bulge. Shown to the right is a schematic of the non-protrusion pathway. Scale bar, 10 µm. Representative images from three independent experiments are shown. Times are h:min relative to anaphase-onset. Oocyte numbers are shown in parenthesis from three independent experiments (b–f, h). Data in graphs are presented as the mean ± SEM. Data points are shown in b. P-values are shown in the graphs, ns denoted P > 0.05. Statistical comparisons were made using either two-way ANOVA in b and c or a two-tailed Student’s t-test in d. See also Supplementary Movies 6 and 7. Source data are provided as a Source Data file.

