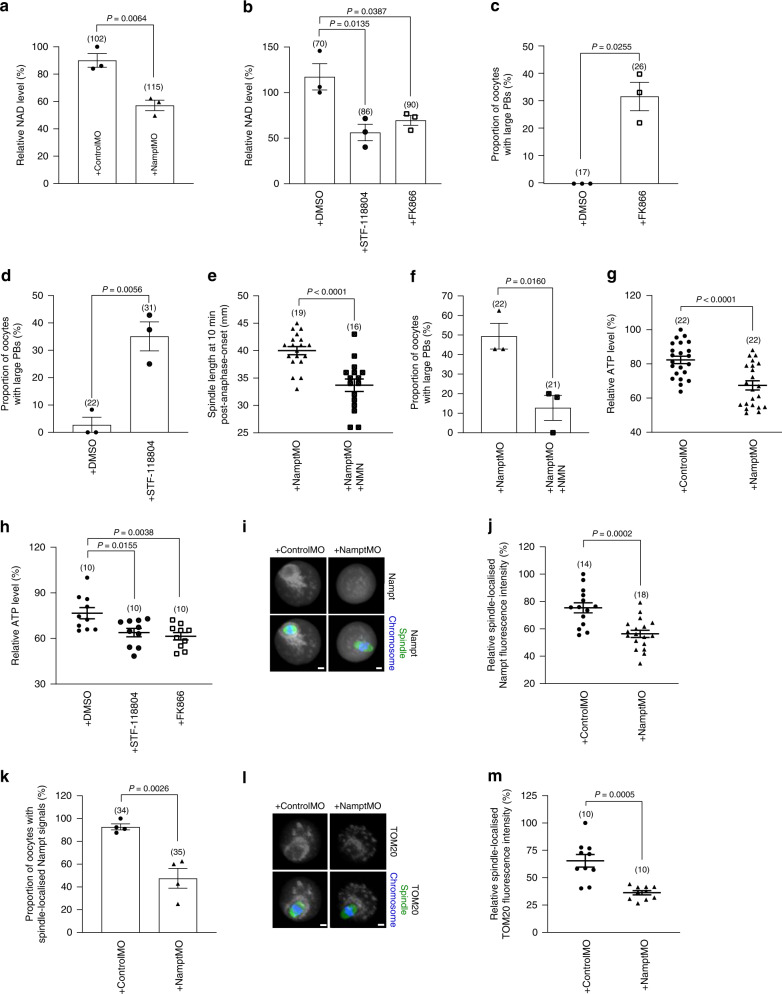
Fig. 6. Nampt co-localises with peri-spindle mitochondria and asymmetry is associated with reduced NAD and ATP levels.
a, b Relative NAD levels in mock-depleted and Nampt-depleted oocytes (a) and in DMSO-, STF-118804- and FK866-treated oocytes (b). c, d Proportion of oocytes with large PBs in DMSO-treated oocytes versus either FK866-treated (c) or STF-118804-treated (d) oocytes. e Spindle length at 10 min post-anaphase-onset in NamptMO-injected and NamptMO+NMN-injected oocytes. f Proportion of oocytes with large PBs in NamptMO-injected and NamptMO+NMN-injected oocytes. g Relative ATP levels in mock-depleted and Nampt-depleted oocytes. h Relative ATP levels in DMSO-, STF-118804- and FK866-treated oocytes. i Representative images of mock-depleted and Nampt-depleted oocytes labelled with anti-Nampt antibody (monochrome), anti-β-Tubulin antibody for labelling the spindle (green) and Hochest for staining chromosomes (blue). Representative images from three independent experiments are shown. j Quantification of spindle-localised Nampt levels in mock-depleted and Nampt-depleted oocytes. k Proportions of mock- and Nampt-depleted oocytes with spindle-localised Nampt signals. l Representative images of mock-depleted and Nampt-depleted oocytes labelled with anti-TOM20 antibody (monochrome), anti-β-Tubulin antibody (green) and Hochest for chromosomes (blue). Representative images from three independent experiments are shown. m Quantification of spindle-localised TOM20 levels in mock-depleted and Nampt-depleted oocytes. Scale bars, 10 µm. Oocyte numbers are shown in parenthesis from three independent experiments (a–h, j, k and m). Data in graphs are presented as the mean ± SEM. Data points are shown in a–d, f and k. P-values are shown in the graphs. Statistical comparisons were made using either a one-way ANOVA in b and h or two-tailed Student’s t-test in a, c–g, j, k and m. Source data are provided as a Source Data file.

