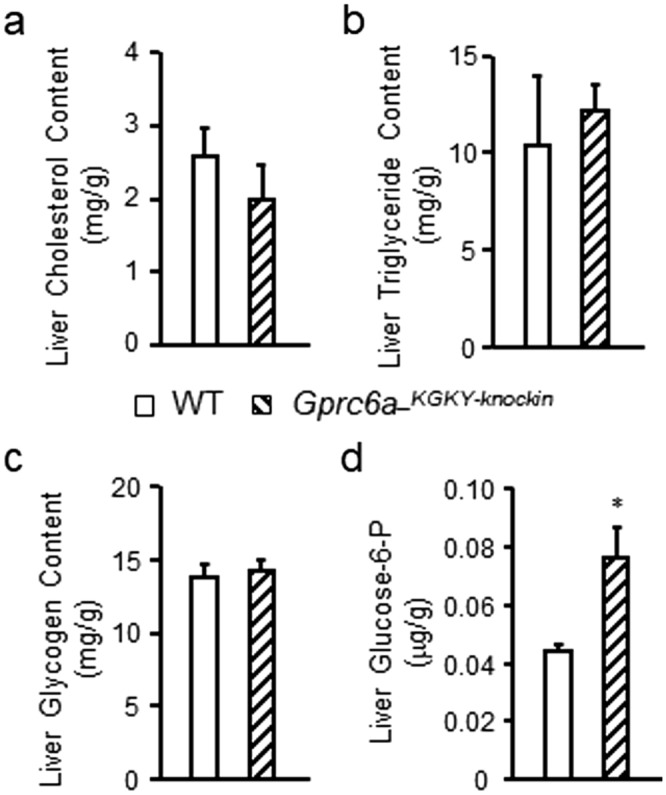
Figure 5.

Characterization of additional liver parameters in Gprc6a-KGKY-knockin mice. Comparison of the contents of cholesterol (a), triglyceride (b) and glycogen (c), and glucose-6-phosphate (Glucose-6-P) (d) in liver from control group and Gprc6a-KGKY-knokin male mice at age of 10 week-old. Values represent the mean ± SEM. *Significant difference between control group and Gprc6a-KGKY-knockin mice (P < 0.05, Student’s t test; n = 6).
