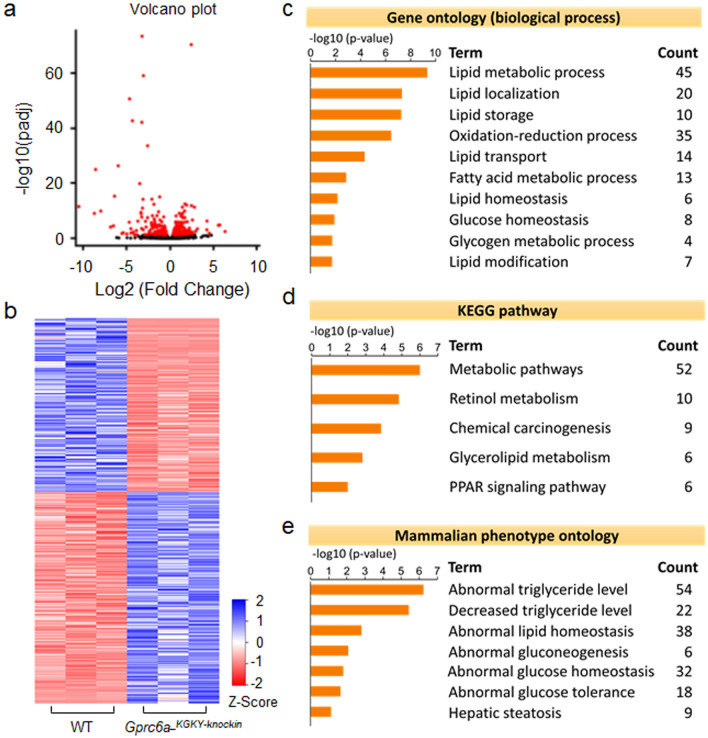
Figure 6.
Hepatic gene expression in the liver of Gprc6a-KGKY-knockin mice. (A and B) Volcano plot (a); Heat map (b) of regulated genes between WT and Gprc6a-KGKY-knockin mice. Blue and red colors indicate high and low gene expression, respectively. Volcano plot and heat map visualization of the hepatic transcriptome demonstrated distinct differences between WT and Gprc6a-KGKY-knockin mice. (c–e) Gene ontology (c), the Kyoto Encyclopedia of Genes and Genomes pathway (KEGG) (d) and Mammalian phenotype (e) in the liver of Gprc6a-KGKY-knockin mice. The top rank ordered processes, maps and networks are based on statistical significance.

