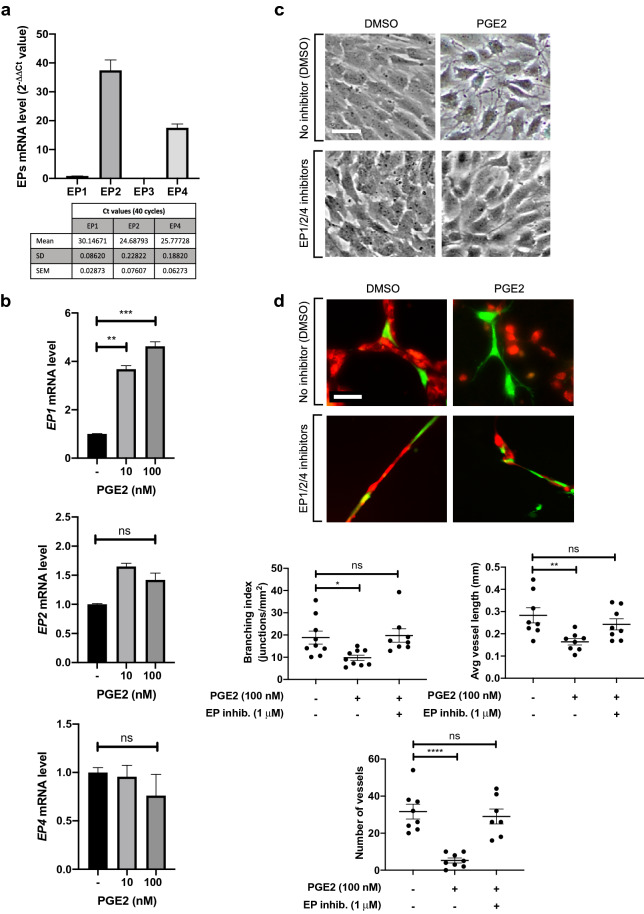
Figure 4.
Inhibition of EP1, EP2 and EP4 restores pericyte–EC interaction. (a) RT-qPCR analysis of EP receptor expression profile in HBVPs. The different primer sets were validated for an efficiency of 2 ± 5%. EP3 expression was undetectable. (b) The effect of PGE2 on EP1, EP2 and EP4 expression in HBVPs was assessed by RT-qPCR 72 h post-treatment. The mRNA expression level of each EP was normalized to that of cyclophilin A using the delta-delta Ct method. Fold change relative to the control is shown. (c) HBVPs were treated with a cocktail of EP1 (ONO-8713), EP2 (PF-04418948) and EP4 (ONO-AE3-208) inhibitors (1 μM each) in DMSO or DMSO vehicle alone, then 5 h later with 100 nM PGE2 in DMSO or DMSO alone. Cell morphology was observed 72 h later. Scale bar 50 μm. (d) HBVPs (green) subjected to the same treatments as described in c were co-cultured on Matrigel with HUVECs (red) for 18 h. Scale bar 50 μm. The branching index (number of junctions/mm2), average vessel length and number of vessels were measured using Angiotool and ImageJ. One-way ANOVA test, *p < 0.05; **p < 0.01; ***p < 0.001; ****p < 0.001; ns, not significant.

