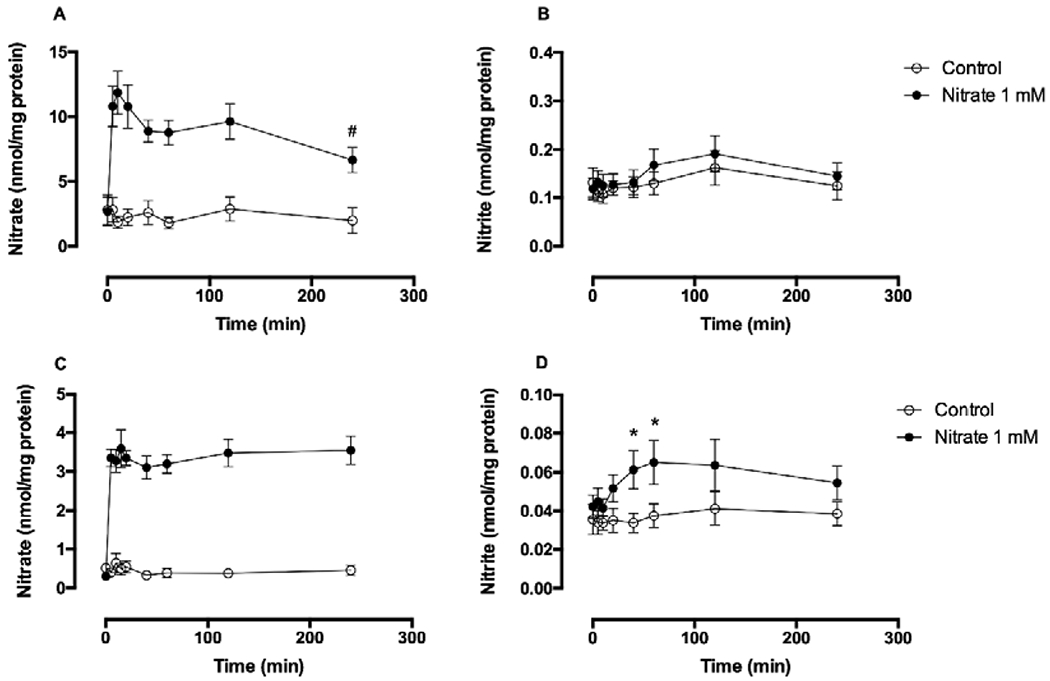
Figure 1. Nitrate uptake and metabolism in myoblasts (A, B) and myotubes (C, D).

Primary human skeletal muscle cells (5 × 10⁵ cells) were plated in a 60-mm dish. For myotube formation, human skeletal muscle cells were cultured in differentiation medium for 5 days. Nitrate (1 mM) was added to either myoblasts or myotubes and incubated at 37°C for 5, 10, 20, 40, 60, 120 and 240 minutes. After washings with PBS, cell lysates were collected into lysis buffer. Intracellular nitrate and nitrite levels were measured by chemiluminescence and normalized to protein concentration. Data are mean ± SEM (n=7). *P < 0.05 compared with control and tested by repeated measured ANOVA with Tukey’s multiple comparison. #P < 0.05 compared with 10-minute intracellular nitrate levels and tested by t-test.
