
Figure 1: The centromere-targeting region of the CPC phase-separates in vitro under physiological conditions.
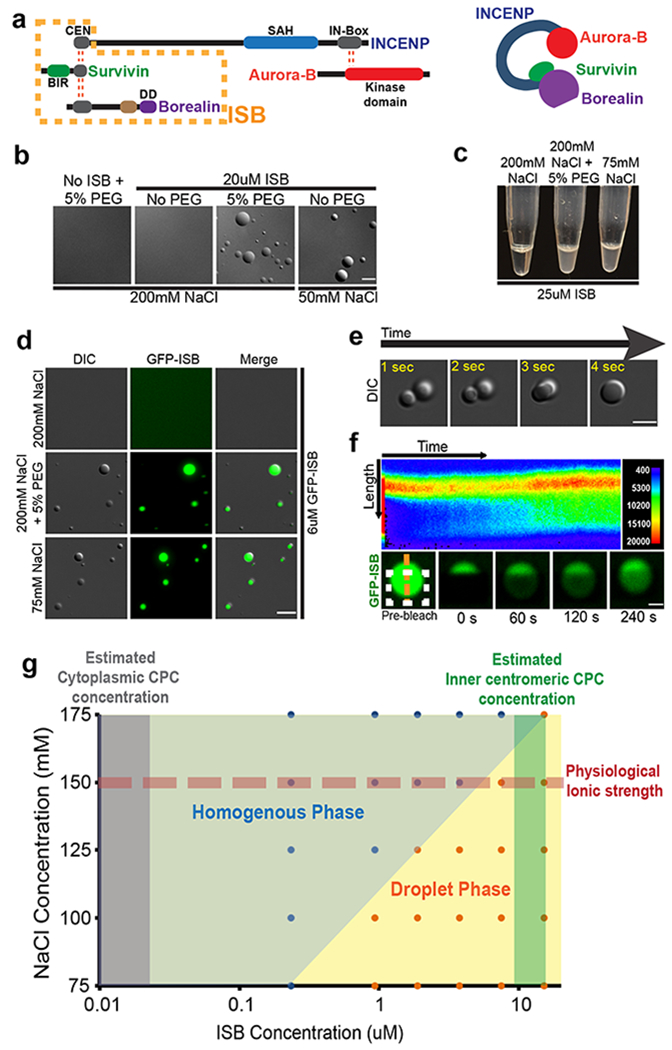
(a) Schematic of the CPC showing various domains in the CPC subunits, where DD is dimerization domain. Red dotted lines indicate interactions between subunits. Orange dotted box indicates the INCENP1-58-Survivin-Borealin (ISB) region used for biochemical analysis in this study. (b) DIC micrographs of the ISB coacervates under indicated conditions. (c) Turbidity generated by the phase-separation of the ISB complex under indicated conditions. (d) The phase-separated droplets of the GFP-ISB complex contain fluorescence. (e) Fusion of ISB coacervates as visualized by time-lapse imaging. (f) FRAP analysis of GFP-ISB coacervates. GFP- INCENP1-58 was photo bleached in the ISB coacervates (white dotted box indicates the bleached area) and recovery of fluorescence was monitored. (Top) Pseudo-colored kymograph of the fluorescent intensity at the orange dotted line (shown in the bottom) of the FRAP experiment. Color corresponds to the fluorescent intensity as shown on the top right. (Bottom) Time-lapse images from the FRAP experiment. Experiment repeated independently 3 times for b-f. (g) Phase diagram of ISB phase-separation as a function of NaCl and ISB concentration. Red dotted line indicates conditions with physiological ionic strength. Blue (homogenous phase) and orange (droplet phase) filled circles show the actual conditions sampled in the experiment. Grey shaded region indicates the estimated cytoplasmic CPC concentration and dark green shaded region indicates estimated centromeric CPC concentration. Scale bar in b and d-f is 5 μm. Source data for g are shown in Supplementary Table 2.