
Figure 2. The dynamics of the CPC subunits in coacervates are similar to those measured in the inner-centromere.
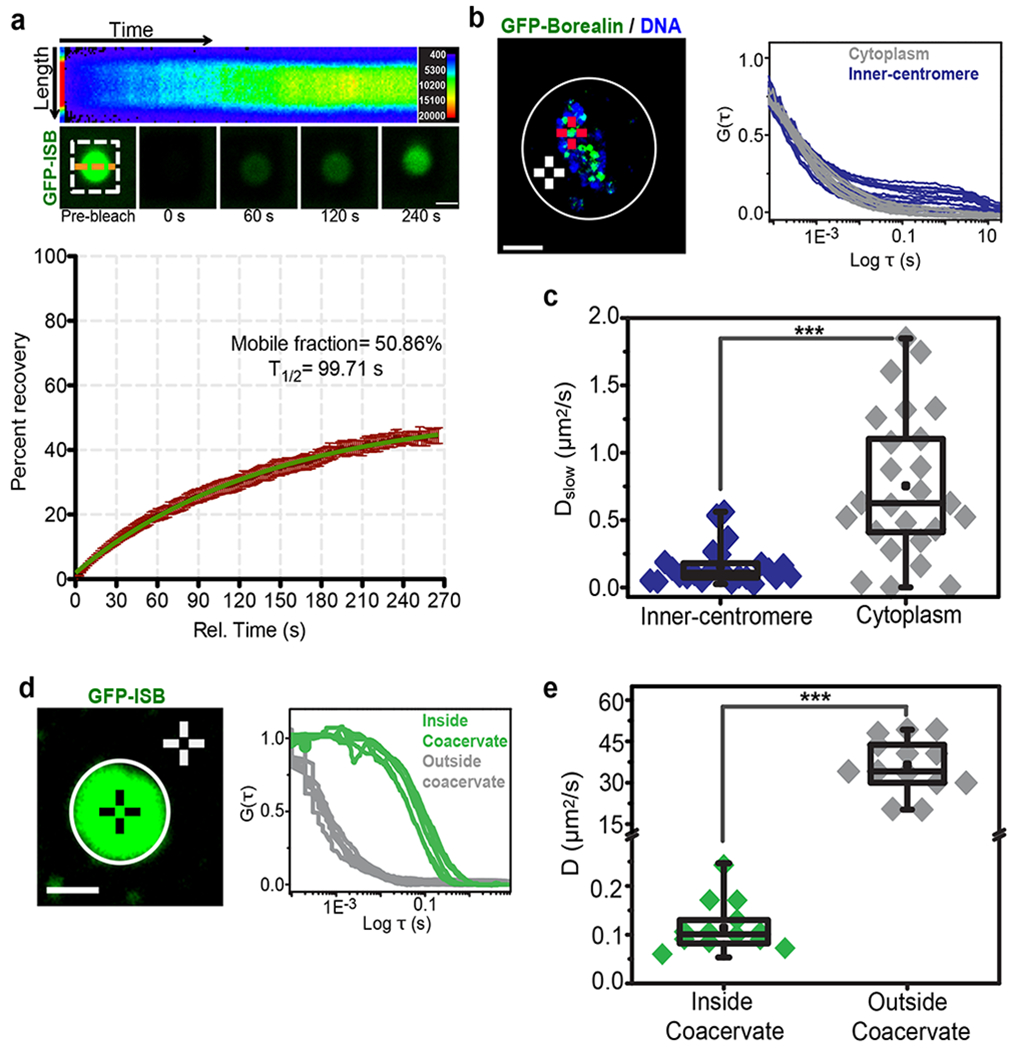
(a) FRAP analysis of GFP-ISB coacervates. GFP- INCENP1-58 was photo-bleached in the ISB coacervates and fluorescence recovery was monitored (white dotted box indicates the bleached area). (Top) Pseudo-colored kymograph of the fluorescent intensity at the orange dotted line of the FRAP experiment. Pseudo-color in the kymograph corresponds to the fluorescent intensity as shown in the key on top right (3 independent repeats). (Bottom) Time-lapse images from the FRAP experiment (bottom) Graph of fluorescence recovery after photo bleaching inside the droplet over time showing mean and SEM at each time point (n=14 coacervates, combined data from 3 independent repeats). Green line indicates curve fitted with one phase association kinetics equation. Mobile fraction is 50.86% with 95% confidence interval ranging from 48.89% to 52.82%. T1/2 is 99.71 s with 95% confidence interval ranging from 90.13 to 111.6 s. (b) (Left) Image of a mitotic cell expressing GFP-Borealin treated with 3.3 μM nocodazole. Red crosshair and white crosshair are examples of the inner-centromeric and cytoplasmic region selected for FCS measurement respectively (3 independent repeats). Scale bar 10 μm. (Right) Normalized FCS curves of GFP-Borealin measurements at inner-centromere (Blue) or in the cytoplasm (Grey). (c) Box and whisker graph of GFP-Borealin’s diffusion rate as part of CPC (Dslow) measured at inner-centromere (n=25 inner-centromeres) or cytoplasm (n=25 spots in cytoplasm) calculated form graph shown in b, combined data from 3 independent repeats, P=3.34E-06. (d) (Left) Image of GFP-ISB coacervate, black crosshair and white crosshair are examples of region selected for FCS measurements inside coacervates or outside coacervates respectively (3 independent repeats). Scale bar is 1 μm. (Right) Normalized FCS curves of GFP-ISB measurements inside the coacervates (Green) or outside the coacervates (Grey). (e) Box and whisker graph of GFP-ISB diffusion rate inside the coacervates (n=13 coacervates) or outside the coacervates (n=14 spots outside coacervates), combined data from 3 independent repeats. For statistical analysis two-tailed T-test was applied, P= 1.54E-08. ***P<0.001, **P<0.01, *P<0.05 and ns P>0.05. All box and whisker graphs represent the median (central line), 25th-75th percentile (bounds of the box), and 5th-95th percentile (whiskers). Source data for a-e are shown in Supplementary Table 2.