
Figure 3: Inner-centromere components are enriched in ISB coacervates.
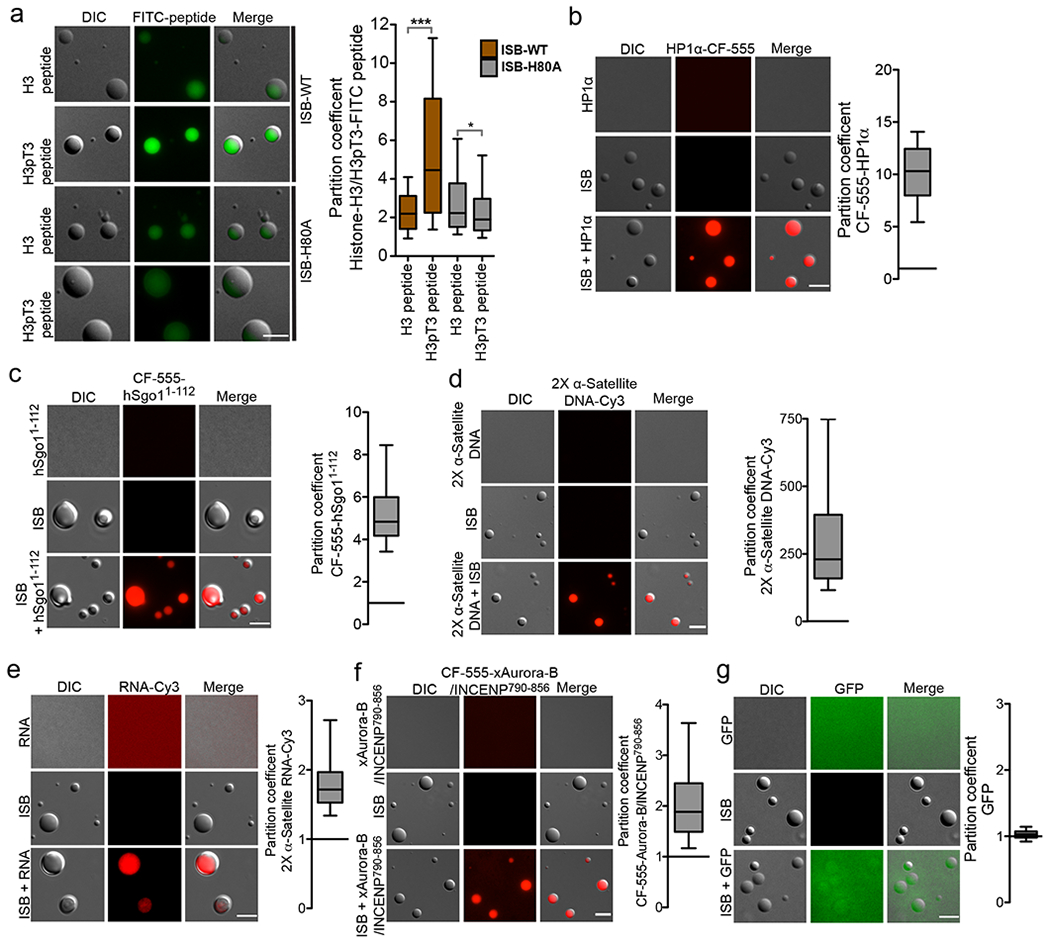
a-g ISB coacervates were mixed with the indicated fluorescent inner-centromere constituents and images for enrichment. (a) Representative micrographs showing enrichment of FITC-histone H3 peptide or FITC-histone H3pT3 peptide in ISB-WT or ISB-H80A mutant coacervates. Control micrographs for FITC peptide alone and ISB-WT or ISB-H80A mutant coacervates alone are shown in Supplementary fig.4d. Graph shows partition coefficient of the H3 and H3pT3 peptide in ISB-WT or ISB-H80A mutant coacervates (82, 63, 76 and 95 coacervates were analyzed for ISB-WT+H3, ISB-WT+H3pT3, ISB-H80A+H3 and ISB-H80A+H3pT3 respectively). For statistical analysis two tailed Mann-Whitney test was applied, ***P<0.0001 and * indicates P=0.0498. (b) Purified HP1 protein was labeled with CF555 (CF555-HP1α), incubated with ISB coacervates and imaged. Representative micrograph and graph of partition coefficient (n=171 coacervates), (c) The partition coefficient of CF555-hSgo11-112 was measured as in B (n=129 coacervates), (d) 2X α-satellite DNA-Cy3 (n=193 coacervates), (e) 2X α-satellite RNA-Cy3 (n=129 coacervates), (f) CF555-xAurora-B/INCENP790-856 (n=200 coacervates), and (g) GFP (n=133 coacervates) in ISB phase. For a-g, combined data from 3 independent experiments. Scale bar is 5 μm. All box and whisker graphs represent the median (central line), 25th-75th percentile (bounds of the box), and 5th-95th percentile (whiskers). Source data for c-g are shown in Supplementary Table 2.