
Figure 4: Inner-centromere components can induce ISB phase-separation.
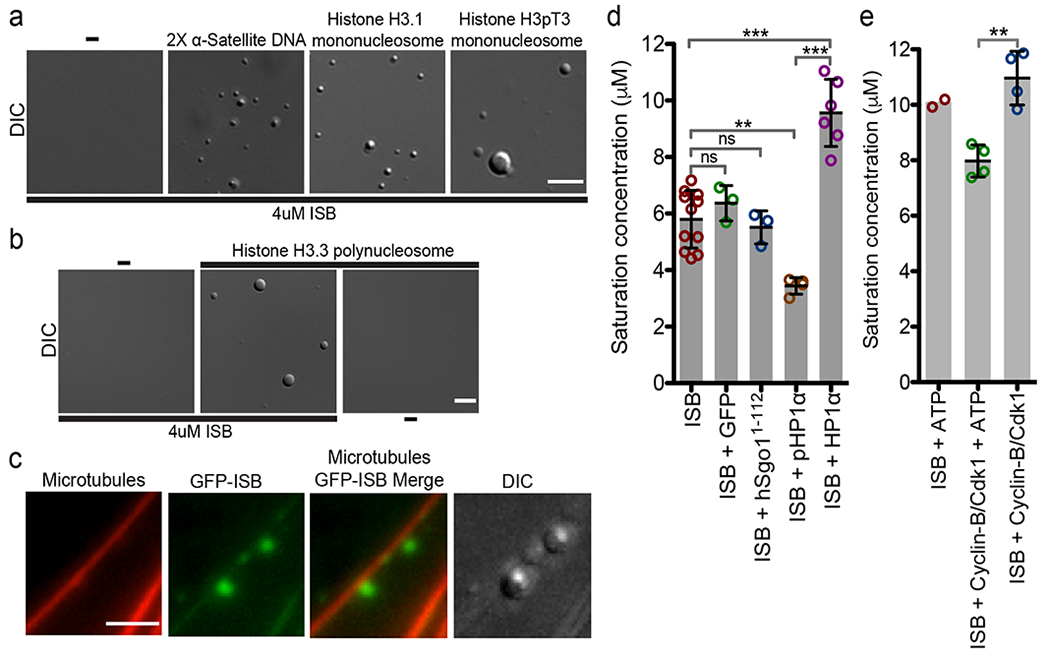
(a) Micrographs showing phase-separation of 4 μM ISBWT induced by 13 ng/ul of 2X α-satellite, Histone H3.1 and H3pT3 mono-nucleosomes in buffer containing 150 mM NaCl. Scale bar is 5 μm. (b) Micrographs showing phase-separation of 4uM ISBWT induced by 80 ng/ul Histone H3.3 poly-nucleosomes in buffer containing 150 mM NaCl. Scale bar is 5 μm. (c) Micrographs showing phase-separation of GFP-ISB (5 μM) induced on paclitaxel-stabilized rhodamine labeled microtubules (1μM) in buffer containing 150 mM NaCl. Scale bar is 3 μm. For a-c the experiment was repeat independently 3 times. (d) Mitotically phosphorylated HP1α lowers the saturation concentration of ISB. Saturation concentrations of ISB (n=11) or when its mixed with equimolar amounts of GFP (n=3), hSgo11-112 (n=3), pHP1α (n=3), and HP1α (n=6) in buffer containing 150 mM NaCl measured by spin-down method. (e) CDK phosphorylation lowers saturation concentration of ISB. Saturation concentration of ISB upon incubation with ATP (n=2), Cyclin-B/Cdk1 and ATP (n=4), and Cyclin-B/Cdk1 (n=4) in kinase buffer containing 150 mM NaCl measure by spin-down method. For d and e, “n” stands for the number of independent experiments. For statistical analysis in d and e, One-way Analysis of Variance followed by Bonferroni’s Multiple Comparison Test was used. ***P<0.001, **P<0.01, *P<0.05 and ns P>0.05. All Bar graphs show mean (central dark line) and error bars are ±s.d.; Open circles show the individual data points. Source data for d and e are shown in Supplementary Table 2.