
Figure 5: Borealin phase-separates in vivo and inner-centromeric CPC is sensitive to inhibitors of phase-separation.
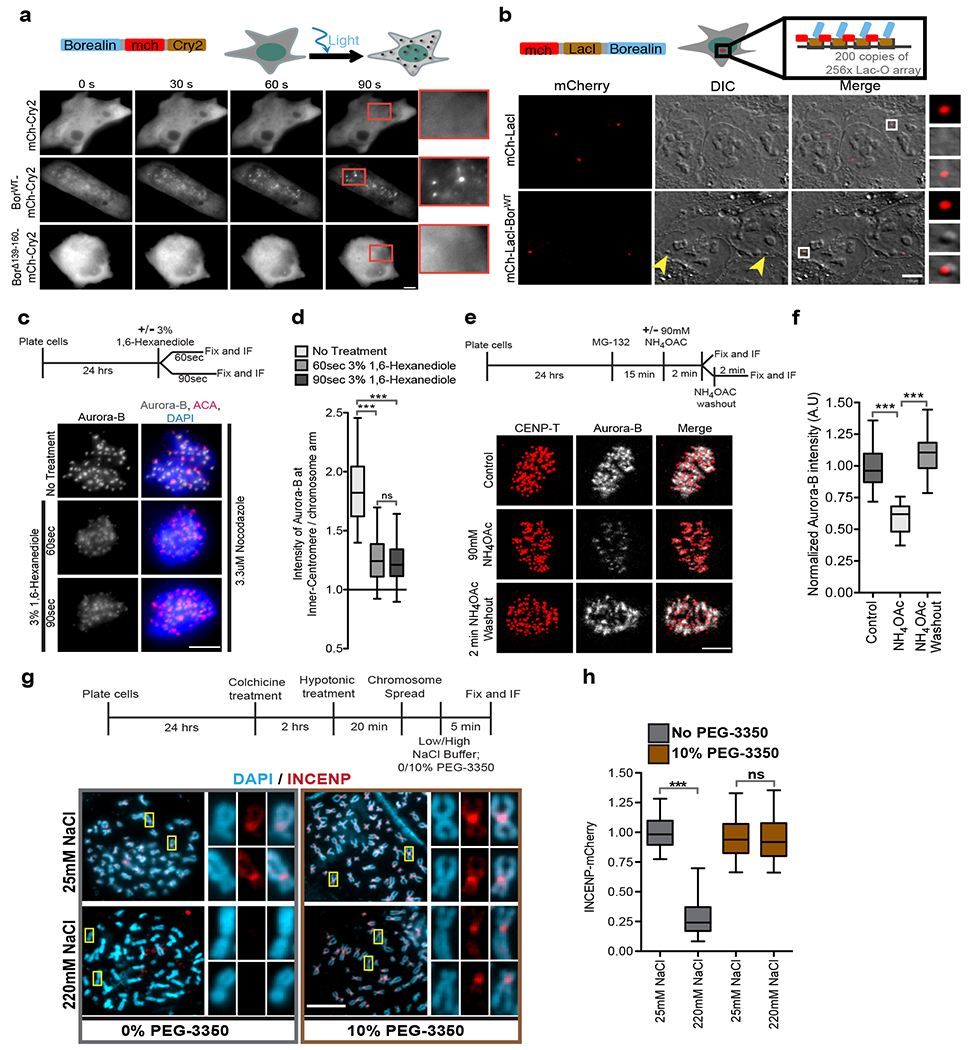
(a) Optodroplet assay. Cells expressing Borealin-mCherry- Cry2 protein were exposed to blue light and followed by time lapse imaging. Quantitation in Supplementary Fig.5a. (b) (Top) Schematic of system to target LacI-Borealin to a LacO array. (Bottom) DIC and mCherry images of cells expressing mCherry-LacI or mCherry-LacI-BorealinWT showing the formation of DIC spot (yellow arrowheads) at the lacO array upon targeting. White box marks the region in the insets. Quantitation in Supplementary Fig.5b. (c) (Top) Experimental setup for c and d. (Bottom) Images (c) and quantification (d) of cells arrested in mitosis with 3.3 μM nocodazole and treated with vehicle control for 90 s or 3% 1,6-Hexanediol for 60 s or 90 s and stained for Aurora-B (grey), ACA (red), and DAPI (blue)(n=158 from 11 cells, n=149 from 10 cells, and n=190 from 12 cells for no-treatment, 60 s and 90 s 1,6-Hexanediol treatment respectively). (e) (Top) Experimental setup for e and f. (Bottom) Images showing Aurora-B (grey) and CENP-T (red) in cells treated with vehicle control or 90 mM NH4OAc or 2 min after NH4OAc washout. (f) Aurora-B fluorescent intensity normalized to control under indicated conditions from e (n=131 from 11 cells for control and n=76 from 9 cells each for NH4OAC treatment and washout). One-Way ANOVA followed by Dunn’s multiple comparison test was applied for d and f. (g) (Top) Experimental setup for g and h. (bottom) Chromosome spread showing DAPI (blue) and INCENP-mCherry (red) under indicated conditions, white boxes mark the regions shown in the insets. (h) Normalized to intensity of INCENP-mCherry at the inner-centromeres under indicated conditions from e. (n=318, 430, 412, and 892 for 25 mM NaCl, 220 mM NaCl, 25 mM NaCl + 10% PEG-3350, and 220 mM + 10% PEG-3350 respectively). Two-tailed T-test was applied (ns indicated P=0.6688). “n” is the number of inner-centromeres measured and *** indicates P<0.0001 and ns indicates P>0.05. Scale bar=5 μm except b=7μm. Two independently experimental repeats for a-h. Box and whisker graphs: median (central line), 25th-75th percentile (box), and 5th-95th percentile (whiskers). Source data for d,f and h are shown in Supplementary Table 2.