
Figure 6: The phase-separation property of the CPC is crucial for its localization to inner-centromeres and midzones.
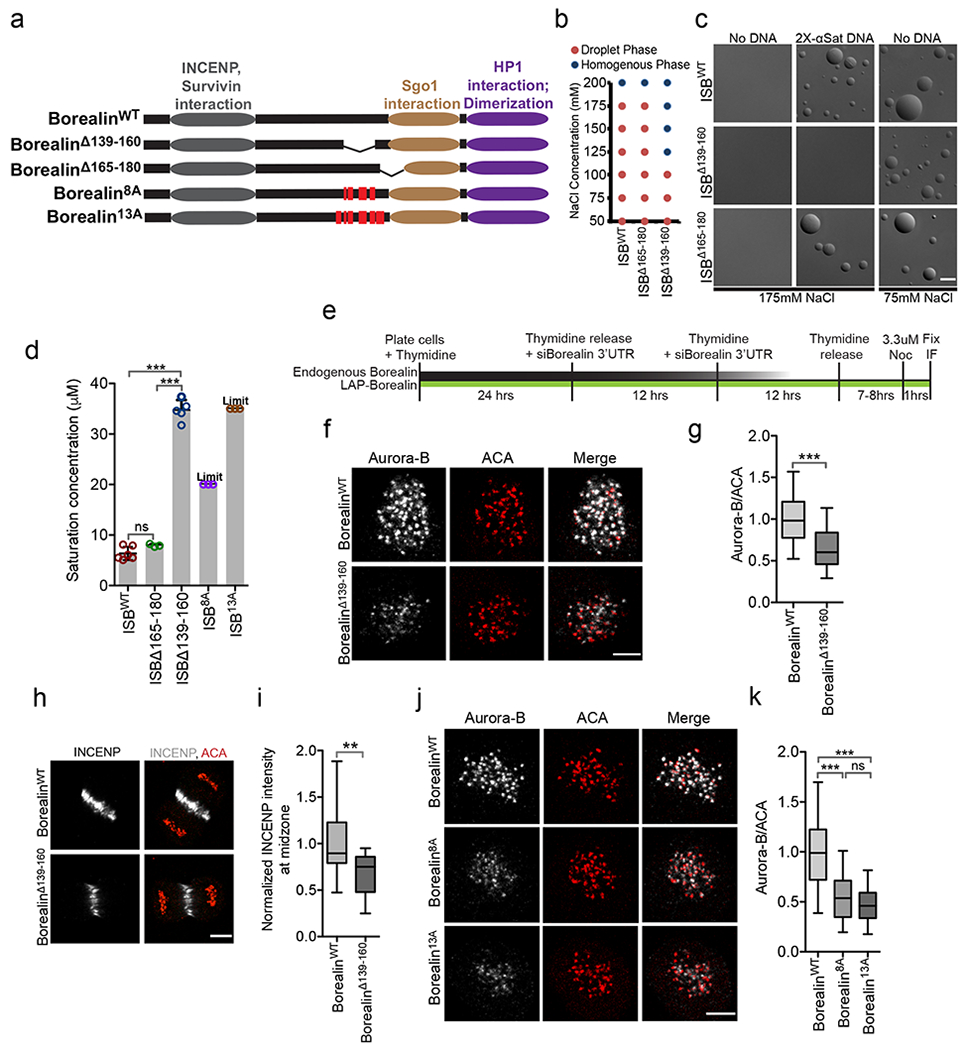
(a) Borealin domains and mutants tested in b-k, red vertical lines indicate the mutated residues. (b) Phase of 20 μM ISBWT, ISBΔ165-180 or ISBΔ139-160 at indicated NaCl concentration. (c) Micrographs of ISBWT or mutant at indicated condition in presence 8 μM ISB and +/−58 ng/ul 2X α-satellite DNA, repeated twice. (d) Saturation concentration of ISBWT (n=6), ISBΔ165-180 (n=3), ISBΔ139-160 (n=5), ISB8A (n=3), and ISB13A (n=3) in buffer containing 150 mM NaCl. “n” is number of independent experiments. “Limit” indicates that phase-separation was not observed at the maximum concentration that could be tested. Bar graphs: mean, error bars ±s.d.; open circles= individual data points. One-way Analysis of Variance followed by Bonferroni’s Multiple Comparison Test. ***P<0.001, **P<0.01, *P<0.05 and ns P>0.05. (e) Experimental design for knockdown and replacement of endogenous Borealin for f, g, j and k. (f) Aurora-B and ACA in cells rescued with either LAP-BorealinWT or LAP-BorealinΔ139-160 and treated with 3.3 μM nocodazole. (g) Normalized intensity of Aurora-B/ACA from experiment shown in f (n=235 from 13 cells for LAP-BorealinWT, n=195 from 14 cells for LAP-BorealinΔ139-160, repeated twice). Two-tailed unpaired T-test with Welch correction was applied. (h) Staining of INCENP and ACA in anaphase cells rescued with either LAP-BorealinWT or LAP-BorealinΔ139-160. (i) Normalized INCENP intensity (to the mean intensity of LAP-BorealinWT) at the midzone form experiment shown in h (n=16 and n=15 midzones for LAP-BorealinWT and LAP-BorealinΔ139-160). Two-tailed T-test was applied; **P=0.0045. (j) Aurora-B and ACA in cells rescued with LAP-BorealinWT (n=154 from 9 cells), LAP-Borealin8A (n=123 from 8 cells) or LAP-Borealin13A (n=97 from 9 cells) and treated with 3.3 μM nocodazole; repeated twice. (k) Normalized intensity of Aurora-B/ACA from experiment shown in j. “n” indicates number of inner-centromeres measured for g and k. 2 independent repeats for f-k. For statistical analysis One-way analysis of variance followed by Bonferroni’s Multiple comparison test was applied. For the whole figure *** indicates P<0.0001 and ns indicates P>0.05. Scale bar is 5 μm. Box and whisker plots: median (line), 25th-75th percentile (box), and 5th-95th percentile (whiskers). Source data for b, d, g, i and k are shown in Supplementary Table 2.