
Figure 7: The phase-separation property of the CPC is important for its mitotic functions.
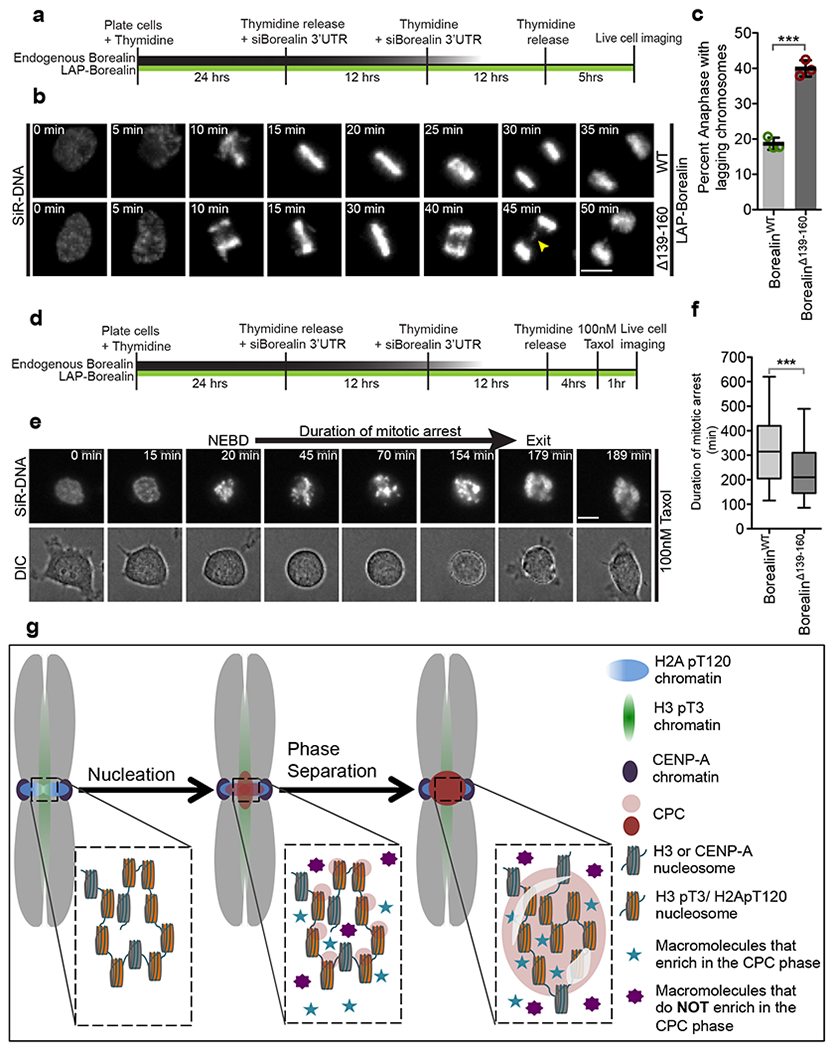
(a) Schematic of the experimental setup for B used to analyze mitotic progression in first mitosis after depletion of endogenous Borealin and complementation with either LAP-BorealinWT or LAP-BorealinΔ139-160. (b) Representative frames from the time-lapse images of cells complemented with either LAP-BorealinWT or LAP-BorealinΔ139-160 undergoing mitosis. Yellow arrow points to the lagging chromosomes in anaphase. 3 independent repeats. (c) Graph showing percent of anaphases with lagging chromosomes in cells rescued with LAP-BorealinWT or LAP-BorealinΔ139-160 (data from n=3 independent experiment (121,107, and 125 cells were analyzed for LAP-BorealinWT; 106, 103, and 86 cells were analyzed for LAP-BorealinΔ139-160). Open circles show individual data points. Error bars are s.d. and central line is mean. For statistical analysis two-tailed unpaired T-test was applied. *** Indicates P=0.0002. Cumulative frequency graph of duration of taxol arrest and duration of various phases of mitosis is shown in Supplementary Fig.7. (d) Schematic of the experimental setup for e used to analyze duration of taxol induced mitotic arrest in first mitosis replacement of endogenous Borealin with either LAP-BorealinWT or LAP-BorealinΔ139-160. (e) Representative frames from the time-lapse images of cells undergoing mitosis in presence of 100nM paclitaxel. “NEBD” refers to the time of nuclear envelope break down and “exit” refers to the time of mitotic exit. Duration from NEBD to exit/death is defined as duration of mitotic arrest. 2 independent repeats. (f) Graph showing duration of mitotic arrest in cells rescued with LAP-BorealinWT or LAP-BorealinΔ139-160 (n=220 cells were analyzed per condition, combined data from 2 independent experiment). Box and whisker plots: median (line), 25th-75th percentile (box), and 5th-95th percentile (whiskers). For statistical analysis two tailed Mann-Whitney test was applied. *** Indicates P<0.0001. For b and e SiR-DNA was used to visualize DNA. Scale bar is 5 μm. (g) Model for the localization of the CPC to the inner-centromere driven by initial nucleation by phospho-histone marks followed by phase-separation of the CPC. Furthermore, some components are enriched in the CPC coacervates (blue stars), while others are excluded (Purple 8-pointed star). Source data for c and f are shown in Supplementary Table 2.