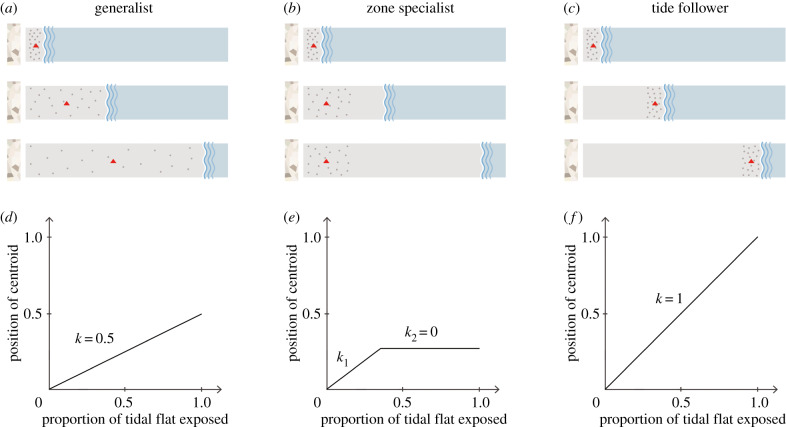
Figure 2.
Schematic representation of three foraging types exhibited by shorebirds. Boxes in (a, b, c) represent the same stretch of a tidal flat with the seawall (high-tide line) on the left and the low-tide line on the right, when varying proportions of the tidal flats are exposed, representing high, ebbing/flooding and low tides, from top to bottom. The leftmost blue wavy lines represent the location of the tidal front, with the areas to the right of the lines covered by water. Grey dots represent individual foraging shorebirds, and the red triangles represent the positions of the abundance centroid. (d, e, f) The centroid plots show the relationship between the position of the abundance centroid and the proportion of tidal flats exposed. (Online version in colour.)

