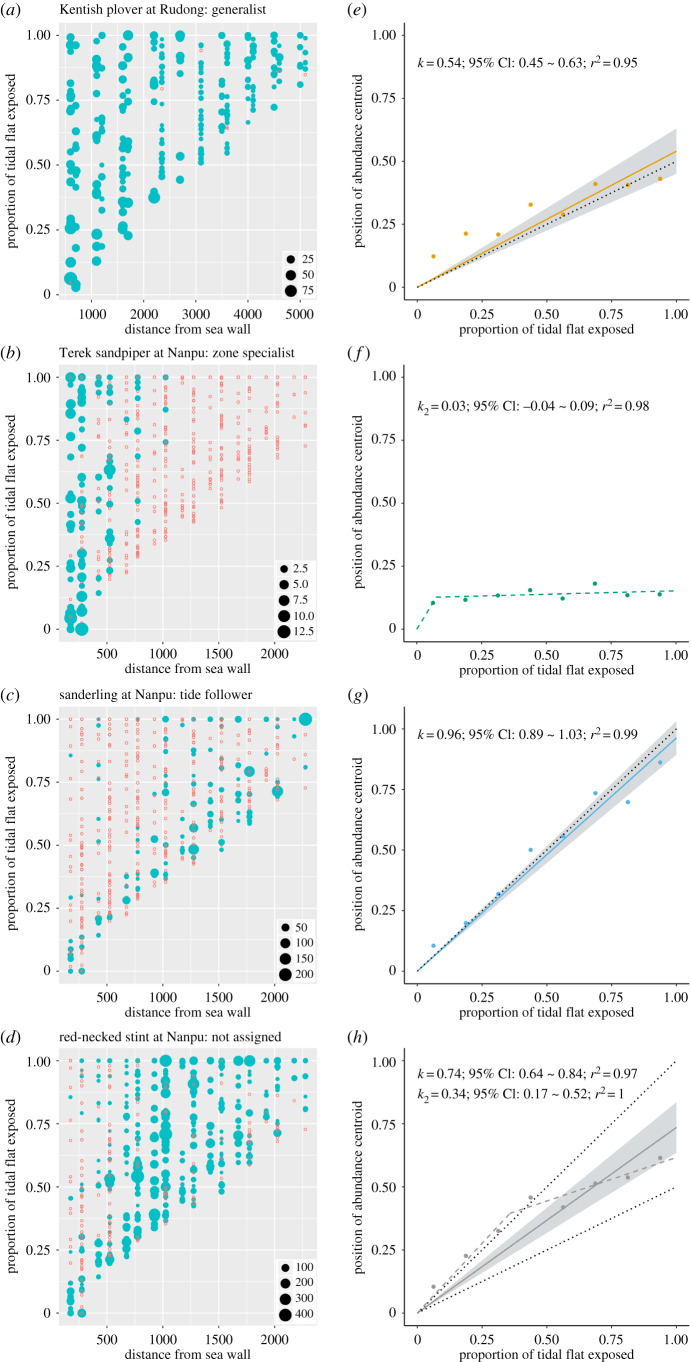
Figure 3.
Distribution and centroid plots of four representative shorebird populations. We show here the representative populations of the three foraging types, and one population that was not assigned. In the spatiotemporal distribution plots (a, b, c, d), the number of foraging individuals recorded in a plot count is represented by the size of the solid blue circles, and the red open circles represent counts with 0 individuals. In the centroid plots (e, f, g, h), solid circles represent the positions of abundance centroid calculated for each tidal period along the tidal flats (0: seawall/high-tide line; 1: low-tide line). The solid line is the best-fitting line for the centroids passing through (0, 0), with 95% confidence intervals shown in grey. The dotted reference line has a slope of 0.5 (generalist) or 1 (tide follower). The dashed line represents the predicted broken-line relationship (zone specialists). All analysed populations are in electronic supplementary material, figure S1. (Online version in colour.)

