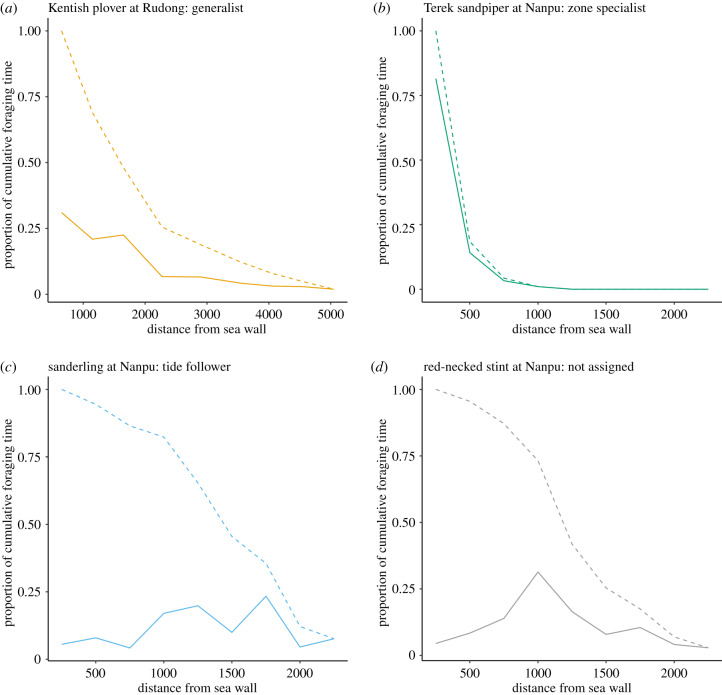
Figure 4.
(a–d) Cumulative foraging time along the tidal flat for four representative shorebird populations. The cumulative foraging time of the same species in figure 3 is shown as the proportion of total cumulative foraging time for a given population at a given site with transects summed. Solid lines show the distribution of cumulative foraging time of each plot along the tidal flat. Dashed lines show the reduction in total cumulative foraging time that would result from the hypothetical loss of tidal flats starting from the seawall and progressing seaward. (Online version in colour.)

