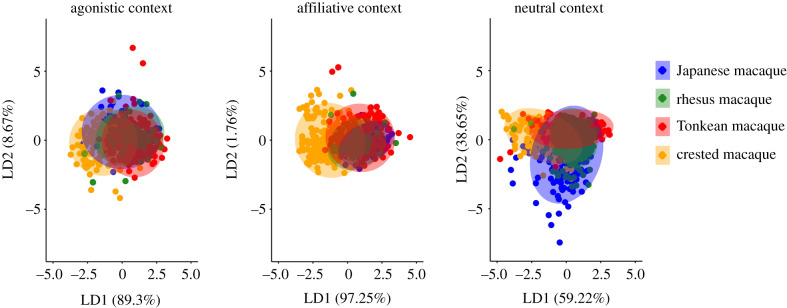
Figure 1.
Comparisons of acoustic distances between species for calls emitted in the agonistic, affiliative and neutral contexts: linear discriminant analysis biplot with the four groups centroids of species on the first two linear discriminants (LD1 and LD2). The ellipses correspond to the 95% confidence interval. (Online version in colour.)

