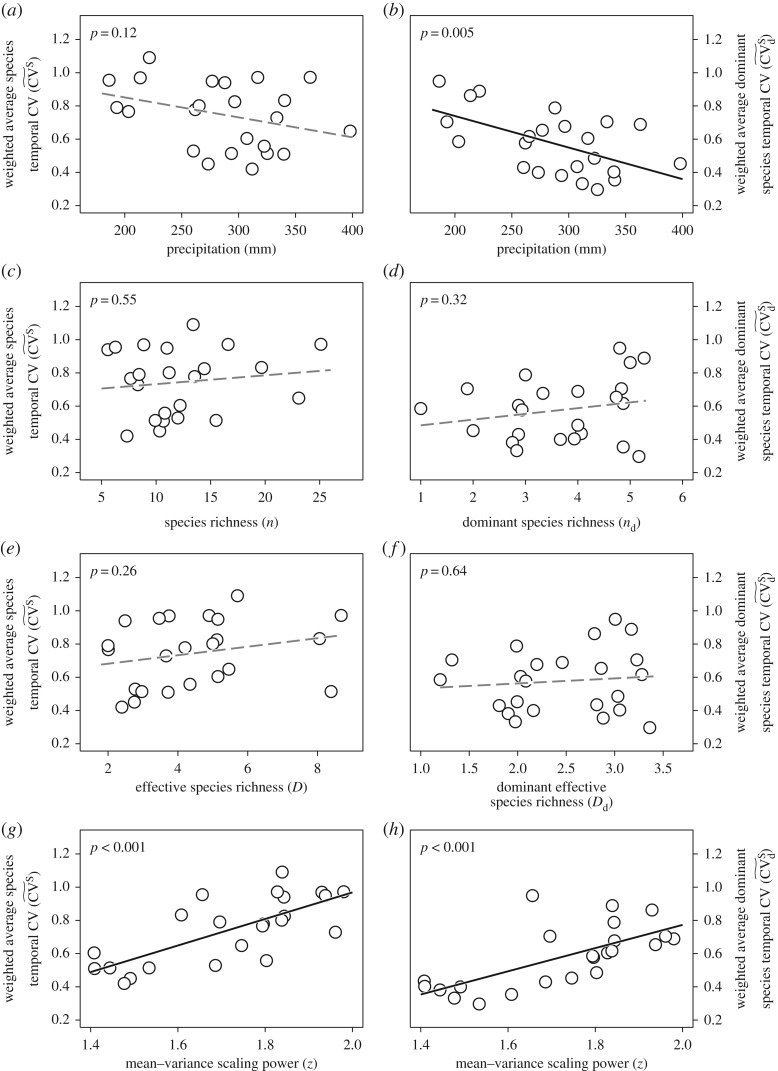
Figure 3.
Weighted average species temporal coefficient of variation (CV) in relation to precipitation, species richness, effective species richness and mean–variance scaling exponent (a,c,e and g, respectively) and weighted average dominant species temporal CV in relation to precipitation, richness and effective richness of dominant species and mean–variance scaling exponent (b,d,f and h, respectively). Black solid lines represent significant linear relationships (p < 0.05) and grey dashed lines represent non-significant linear relationships (p > 0.05).

