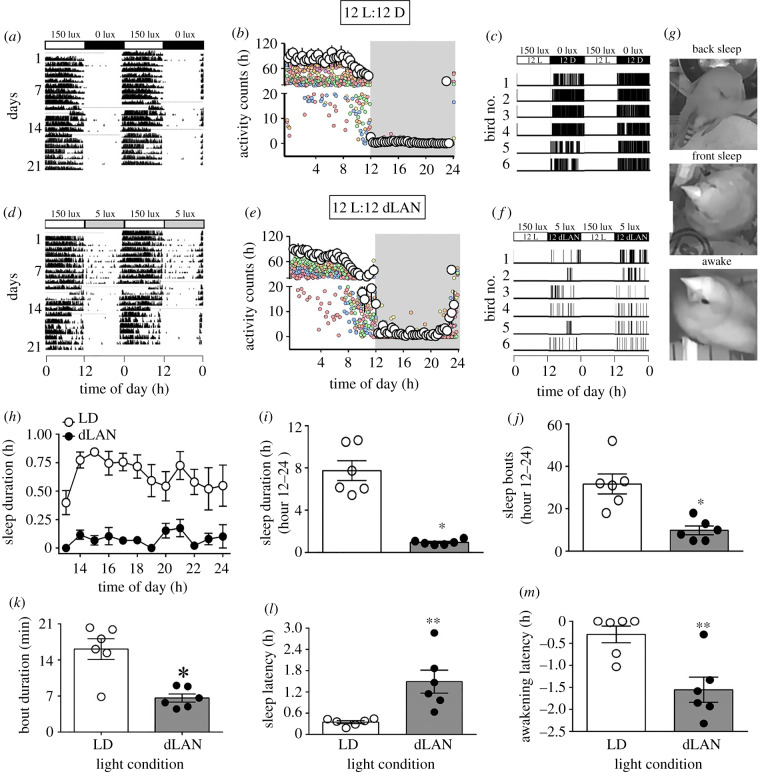
Figure 1.
Effects on activity and sleep behaviours. Adult female zebra finches were exposed to 12 h light (150 ± 5 lux) coupled with 12 h of absolute darkness (0 lux) or of dim light (dLAN, 5 ± 1 lux). Representative double plotted actogram show a 24 h activity-rest pattern under LD (a) and dLAN (d). Black and white portions denote the active and rest states, respectively. Twenty four hour activity-rest profile in 20 min bins (mean ± s.e.) is also shown for both LD (b) and dLAN (e). Representative sleepogram (24 h distribution of sleep-wake pattern over 2 days) under LD (c) and dLAN (f), with sleep (black) and awake (white) states. (g) illustrates representative images of behavioural postures showing back sleep, front sleep and awake states. Mean (± s.e.) hourly profile of the sleep duration (h), total sleep duration (i), total sleep bouts (j), sleep bout length (k), and sleep and awakening latency relative to lights on and lights off, respectively (l, m) during 12 h of the night period. The asterisk (*) indicates a significant difference, as determined by GLMM (h) or by Student's t-test (i–m). p < 0.05 was considered a statistically significant difference. (*p < 0.05; **p < 0.01).

