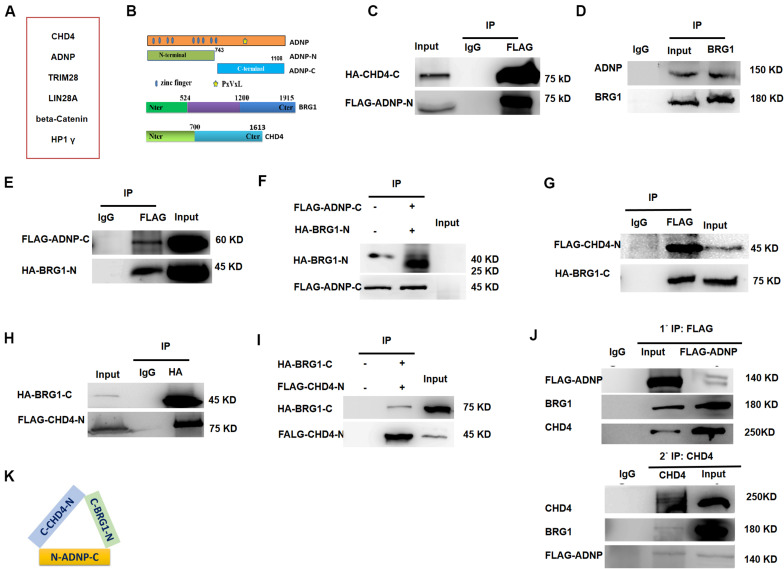
FIGURE 2.
ADNP forms complexes with BRG1 and CHD4. (A) A table showing representative ADNP interacting proteins by IP followed mass-spectrometry assay. (B) Schematic representation of wild type ADNP, BRG1 and CHD4, and their truncated mutant forms. (C) FLAG-tagged ADNP-N pulled down HA-tagged CHD4-C in 293T. (D) Endogenous BRG1 pulled down ADNP in ESCs. (E) FLAG-tagged ADNP-C pulled down HA-BRG1-N in 293T. (F) FLAG-tagged ADNP-C pulled down HA-BRG1-N using a TNT system. (G) FLAG-CHD4-C pulled down HA-BRG1-N in 293T cells. (H) HA-BRG1-N pulled down FLAG-CHD4-C in 293T. (I) FLAG-tagged pulled down HA-BRG1-N using a TNT system. (J) Sequential IP showing that ADNP, CHD4 and BRG1 could form a triplex in ESCs. (K) A cartoon showing the interaction of all three factors, based on the mapping results. All WB and IPs were repeated at least two times. Shown are representative images.

