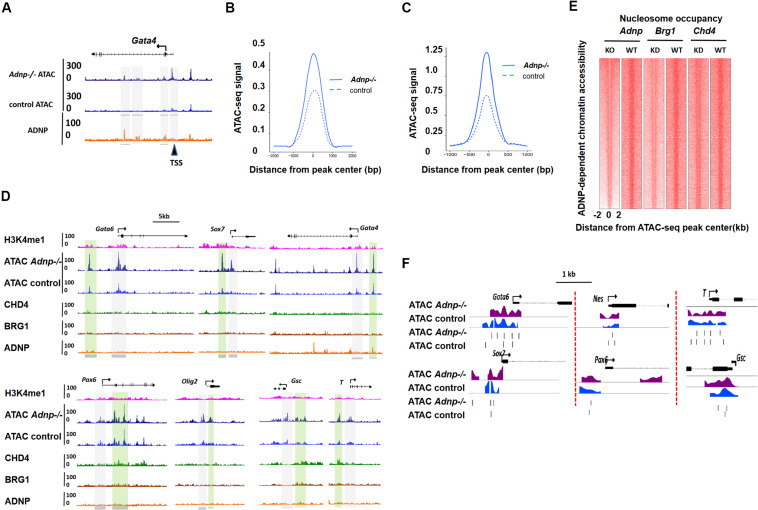
FIGURE 4.
ADNP depletion leads to chromatin accessibility and nucleosome configuration change. (A) A genomic snapshot of ATAC-seq and ADNP ChIP-seq signal at the Gata4 locus in control and Adnp-/- ESCs. Gray color highlighting the ADNP-dependent ATAC-seq peak loci. Black triangle indicating the significant increase of ATAC-seq signal at TSS region where no ADNP ChIP-seq signal was detected. (B) A metaplot of average ADNP-dependent ATAC-seq signal in control and Adnp-/- ESCs. (C) A metaplot of average ATAC-seq signal at TSS regions in control and Adnp-/- ESCs. Similar results were obtained at enhancer regions (not shown). (D) A genomic snapshot of ADNP, BRG1, CHD4 and H3k4me1 ChIP-seq and ATAC-seq at lineage specifying genes in control and Adnp-/- ESCs. H3K4me1 was used for showing the poised enhancer regions. Gray color highlighting TSS-proximal regions, and green color highlighting enhancer regions. Except for Gata4, no key lineage specifying genes were bound by ADNP. Chromatin accessibility was increased at TSS-proximal and enhancer regions. (E) Nucleosome occupancy around ATAC-seq peak center in control, Adnp knockout, Brg1 knockdown and Chd4 knockdown ESCs. (F) A snapshot of nucleosome configuration at TSS region of representative lineage-specifying genes in control and Adnp-/- ESCs. ATAC-seq experiments were repeated two times for control and Adnp-/- ESCs. ATAC-Seq data for BRG1 and CHD4 were downloaded as described in the text. All analysis was based on the two replicates.

