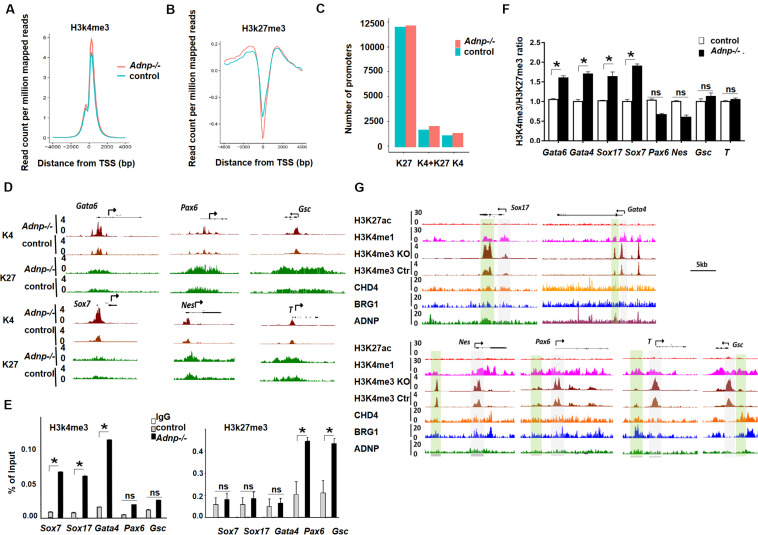
FIGURE 6.
Loss of ADNP caused histone modification change genome-wide. (A) A metaplot analysis of H3K4me3 occupancy at the TSS regions of all genes in control and Adnp-/- ESCs. (B) A metaplot analysis of H3K27me3 occupancy at TSS region of all genes in control and Adnp-/- ESCs. (C) Change of gene numbers of three gene clusters in the absence of ADNP. (D) A genomic snapshot of H3K4me3 and H3K27me3 ChIP-seq peaks at the indicating loci. (E) ChIP-PCR assay of H3K4me3 and H3K27me3 at the indicated gene promoters. (F) A quantitation of H3K4me3/H3K27me3 ratio at indicated gene promoters based on two replicates of H3K4me3 and H3K27me3 ChIP-seq data. (G) Genome browser view at the lineage specifying genes in the control and Adnp-/- ESCs. H3K4me1 ChIP signal was used for showing the poised enhancers. H3K27ac ChIP signal was used for the active enhancers. Gray color highlighting TSS-proximal regions, and green color highlighting enhancer regions. Note, H3K4me3 levels were substantially elevated at enhancer region of PrE but not for mesodermal and ectodermal genes. H3K4me3 and H3K27me3 ChIP-seq were repeated two times. Differences in means were statistically significant when p < 0.05. Significant levels are: *p < 0.05.

