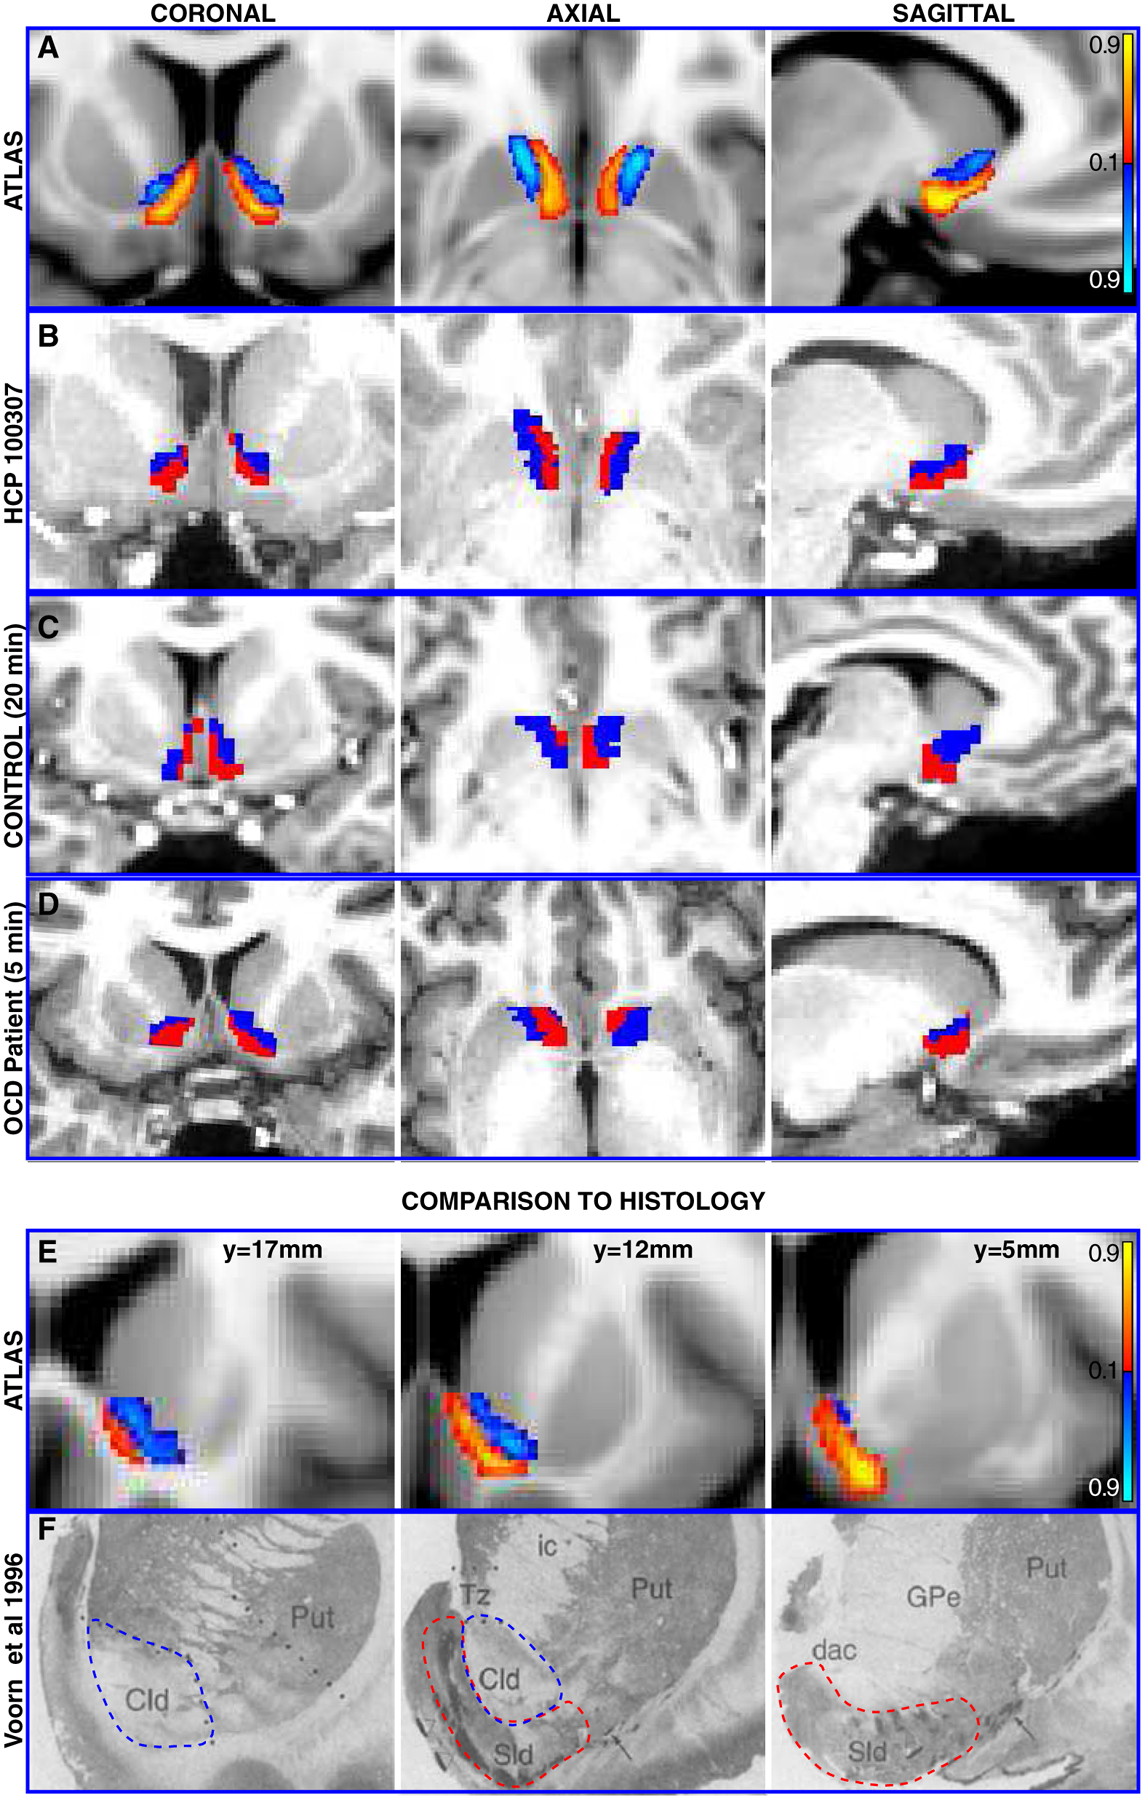
Figure 2. Visualization of cluster output across datasets (A-D) and comparison to histology (EF).

A Coronal, axial, and sagittal views of the probabilistic atlas created from registering all HCP subjects’ cluster output to common space (MNI152). Intensity values indicate strength of evidence for the presence of a given subregion. B Coronal, axial, and sagittal views of cluster output for a single subject from the HCP dataset. C Coronal, axial, and sagittal views of output from application of clustering procedure to a separate, lower quality dataset with ~20 minute acquisition time. D Coronal, axial, and sagittal views of cluster output from a third, clinically-acquired dataset from a human patient with a 5 minute acquisition time. E Serial coronal views of left NAc subregions from probabilistic atlas for comparison with F, histological sections from human NAc depicting core-like (blue dashed line) and shell-like (red dashed line) divisions of left NAc, adapted with permission from Voorn et al (1996).
Sld = shell-like division, cld = core-like-division, ic = internal capsule, Tz = transitional zone, Put = Putamen, GPe = Globus Pallidus external division, dac = dorsal anterior commissure terminology taken from Voorn et al
