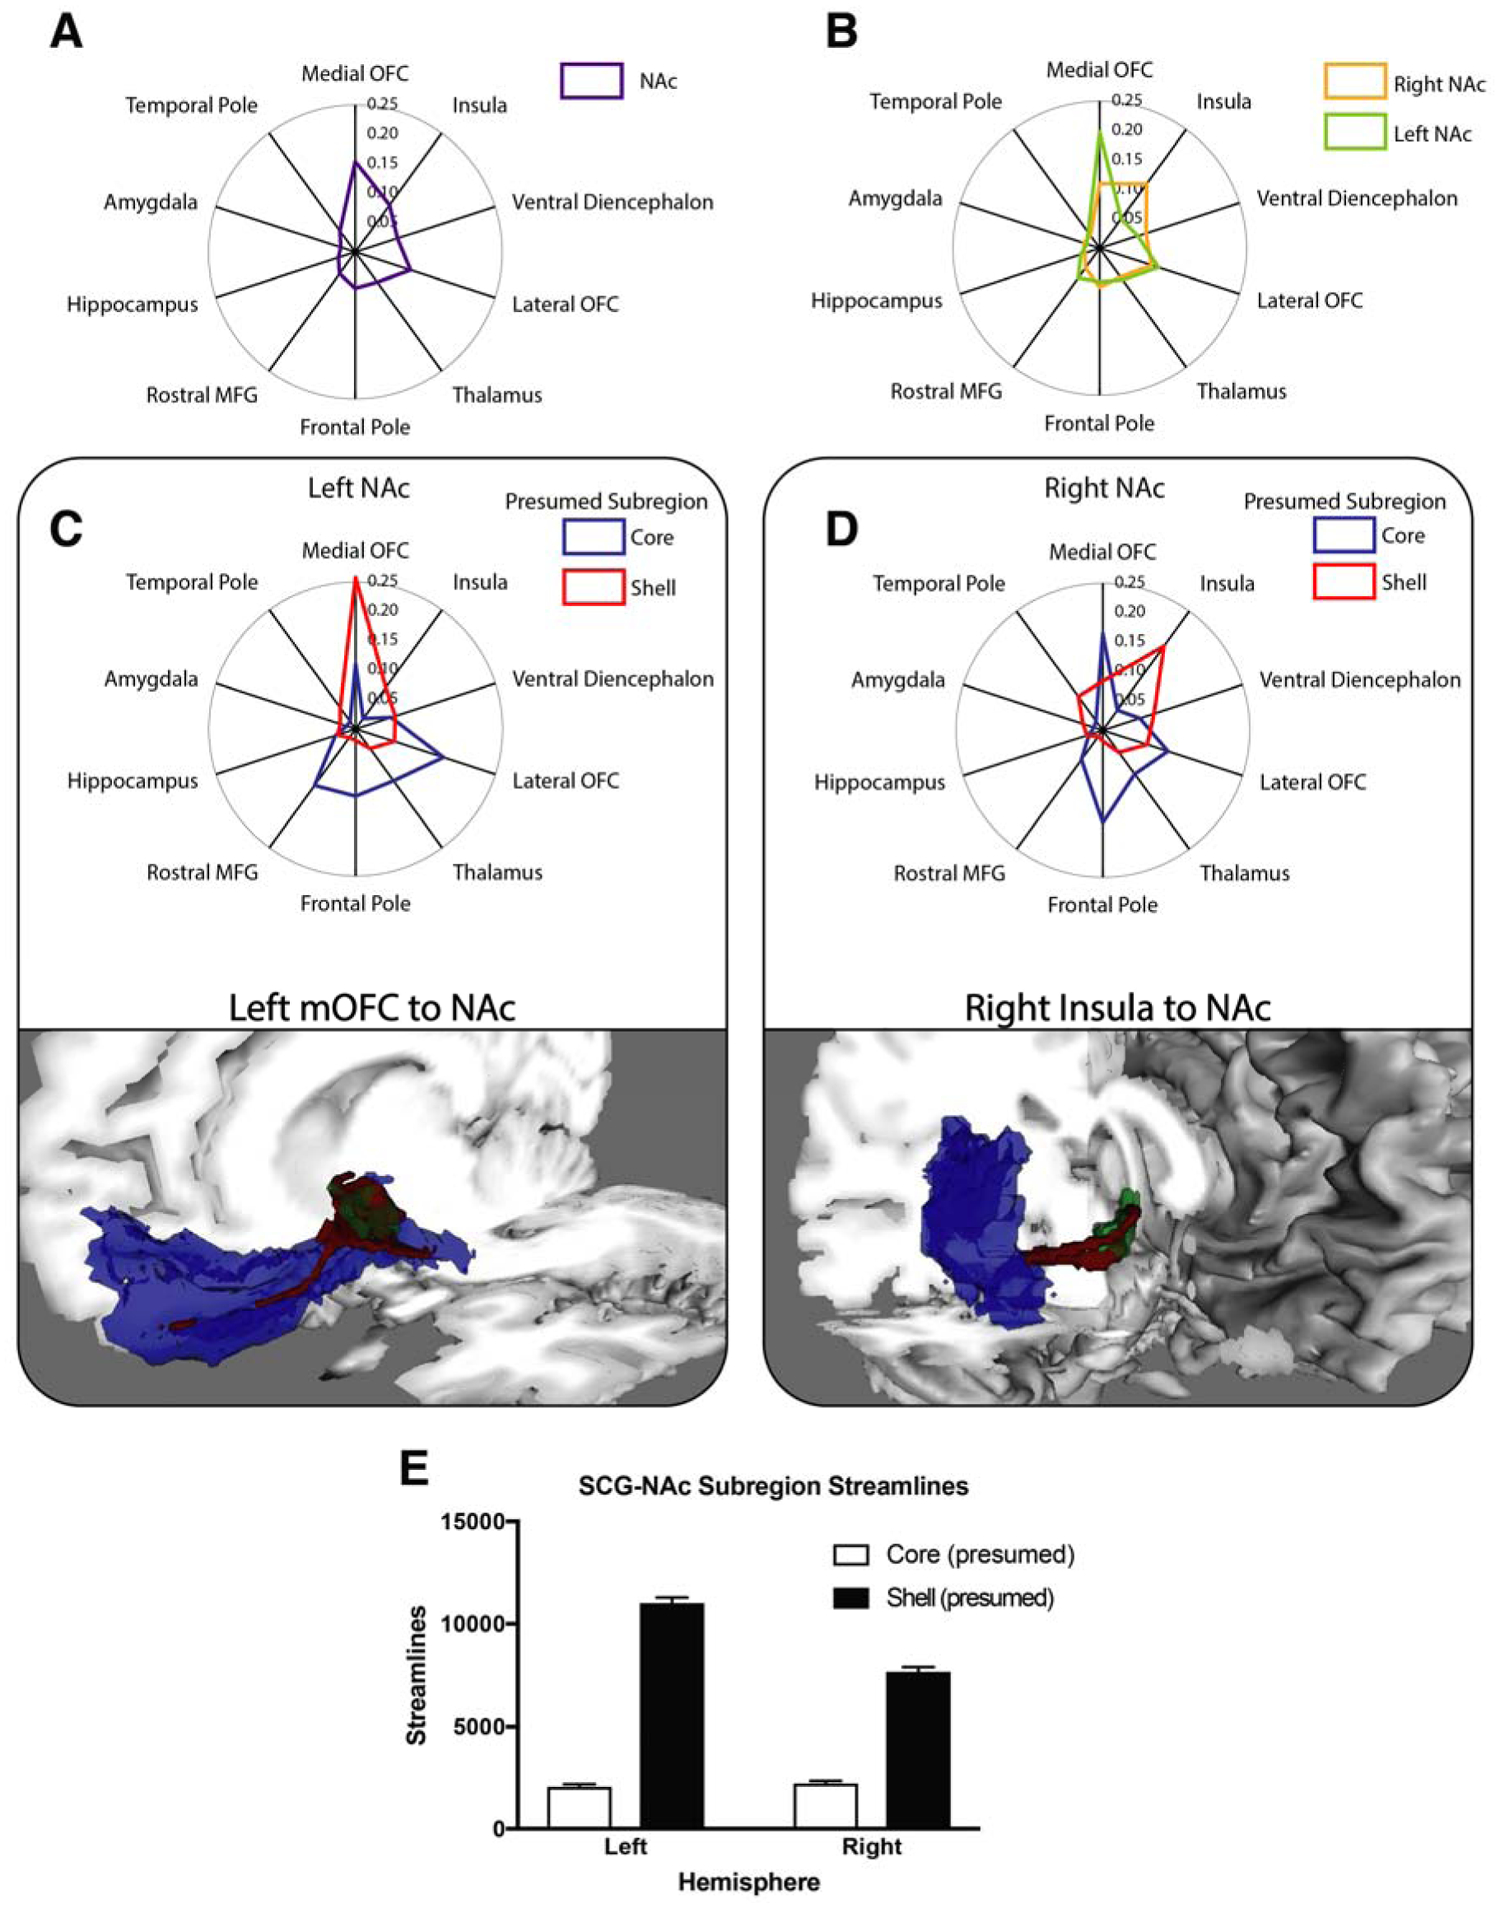
Figure 3. Connectivity of the NAc and connectivity-defined subregions.

A,B Distance along each spoke of radial plots indicates proportion of streamlines intersecting that region of interest. A Streamline proportions of whole NAc averaged across hemispheres demonstrates mOFC has most robust connectivity to NAc. B Streamline probability of whole NAc separated by hemisphere. C,D (top) Connectivity profiles of tractography-defined shell (red) and core (blue) subregions of left (C) and right (D) NAc paired with visualization of principal tracts. C (bottom) Oblique view of tract (red) connecting the mOFC (blue) with the left NAc (green). D (bottom) View of tract (red) connecting the insula (blue) with the right NAc (green). Tract visualizations created by thresholding the probabilistic streamline map at 25% of the peak value. E Comparison of the number of streamlines intersecting tractography-defined presumed shell and core subregions from SCG. NAc, nucleus accumbens, mOFC, medial orbitofrontal cortex, SCG, subcallosal gyrus.
