
Figure 4. CLARITY Tractography demonstrates separate tracts connecting murine infralimbic cortex (ILC) and NAc core and shell.
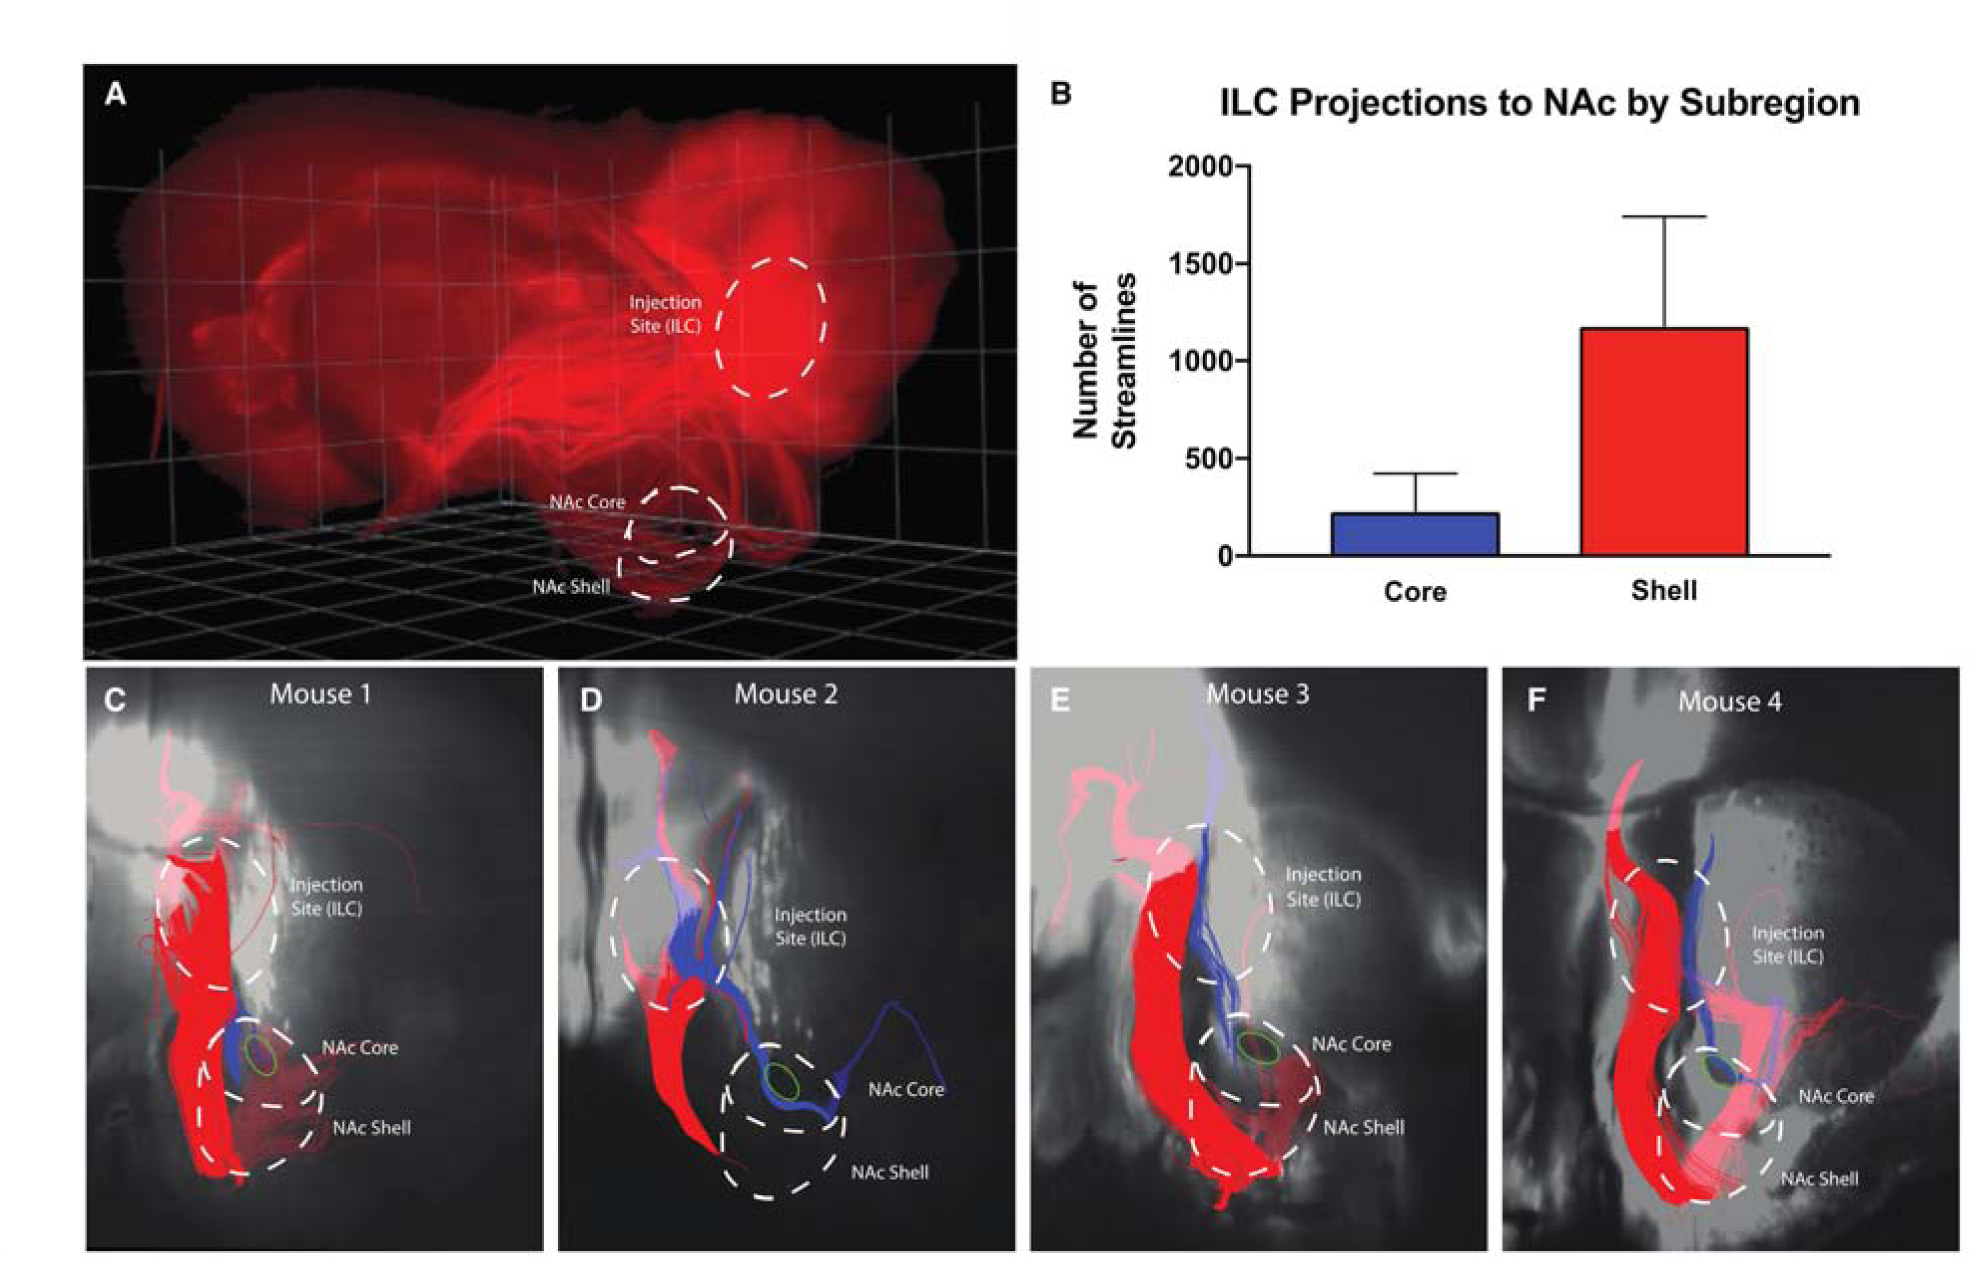
A Raw oblique three-dimensional CLARITY image showing virally-induced florescence of projections from ILC. Borders of ILC, NAc core and shell outlined in white. B Comparison of the mean number of streamlines in each tract averaged across mice. C Tractography results with a representative coronal slice from a mouse brain. Both tracts emanate from injection site in ILC and descend toward the NAc. The larger tract (red) projects through the NAc shell subregion, while the other tract (blue) passes immediately adjacent to the anterior commissure (green oval) in the NAc core. D-F Tractography results from 3 additional mice. As in C, injection sites and NAc subregions are outlined and ensembles projecting to core and shell are colored blue and red, respectively.