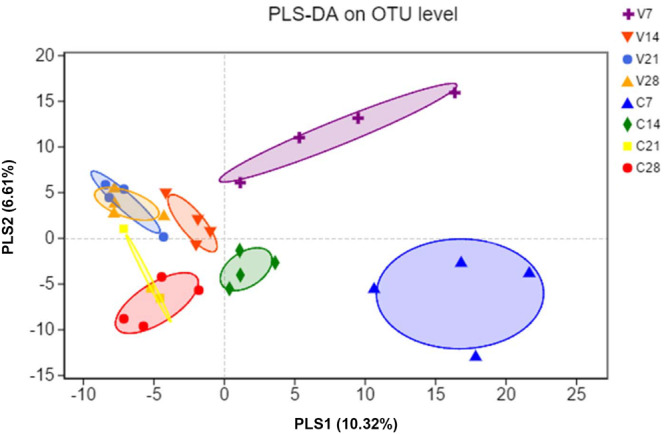
FIGURE 3.

Partial least squares discriminant analysis (PLS-DA) was performed by analyzing the operational taxonomic unit (OTU) level of all samples. Color and shape represent the different groups. PLS-DA scatterplot shows obvious separation (P < 0.05, ANOSIM) and compositional differences in gut microbiota between PCV3- (V) and sham-inoculated (C) piglets at four time points (7, 14, 21, and 28 dpi); PLS1 and PLS2 represent 10.32 and 6.61% of variance, respectively (X and Y-axes).
