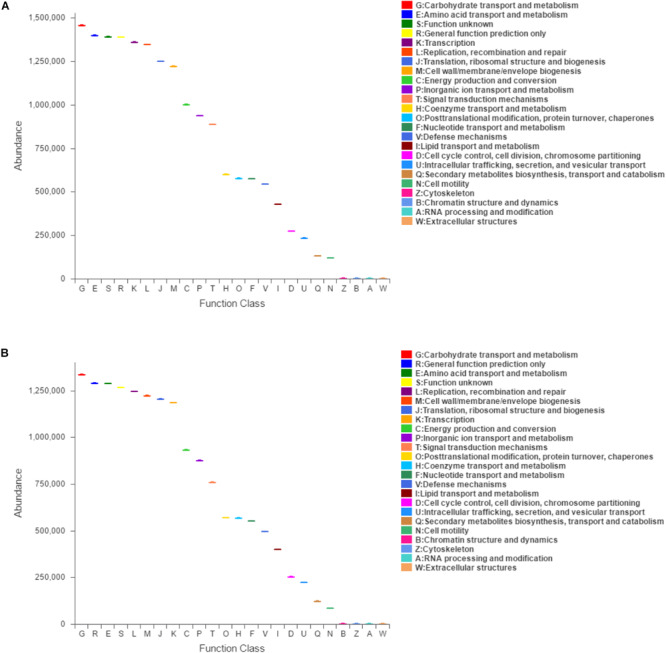
FIGURE 5.

Clusters of orthologous groups (COG)-predicted functional classification at 21 dpi in PCV3- (A) and sham-inoculated piglets (B). V and C letters denote PCV3- and sham-inoculated piglets, respectively. The X and Y-axes represent COG functional numbers and functional abundance. Boxes denote the interquartile range (IQR).
