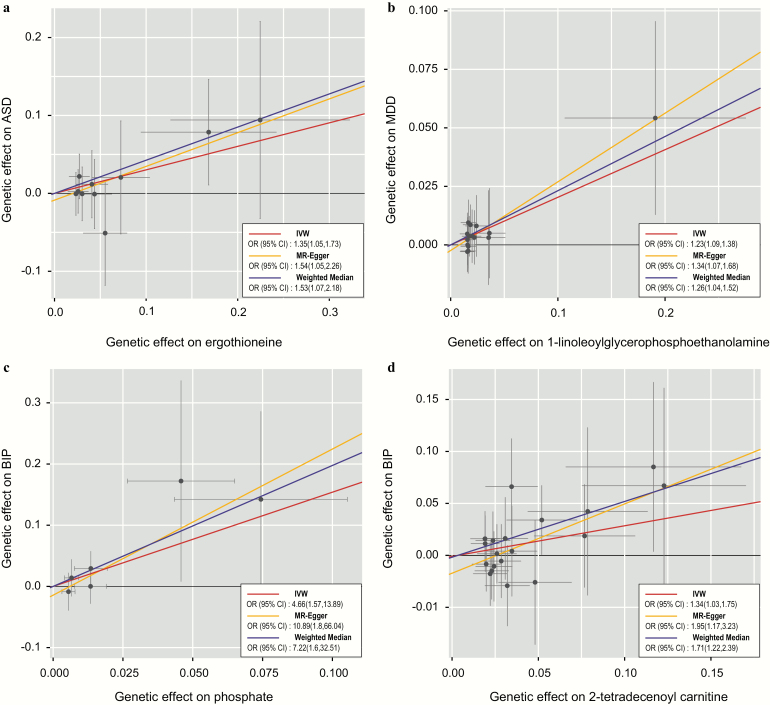
Fig. 3.
Scatter plot showing the genetic associations of four metabolites on the risk of psychiatric disorders. a. ergothioneine on ASD; b. 1-linoleoylglycerophosphoethanolamine on MDD; c. 4-hydroxyhippurate on BIP; d. 2-tetradecenoyl carnitine on BIP. SNPs showing negative signals with metabolites are plotted after orientation to the exposure-increasing allele. Each of the SNPs associated with metabolites is represented by a black dot with the error bar depicting the standard error of its association with metabolite (horizontal) and the target psychiatric disorder (vertical). The slopes of each line represent the causal association for each method. ASD, autism spectrum disorder; MDD, major depression, BIP, bipolar disorder.

