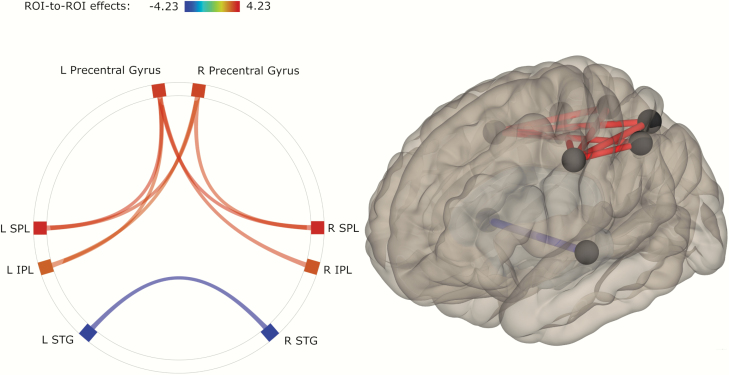
Fig. 1.
ROI pairs with significant differences in functional connectivity between groups. Shades (colours in electronic material) of connections represent t-values according to the given scale. Lighter shade represents higher connectivity, and darker shade represents lower connectivity in patients (red represents higher, blue represents lower connectivity in electronic material).. Note: IPL, inferior parietal lobule; SPL, superior parietal lobule; STG, superior temporal gyrus; L, left; R, right.

