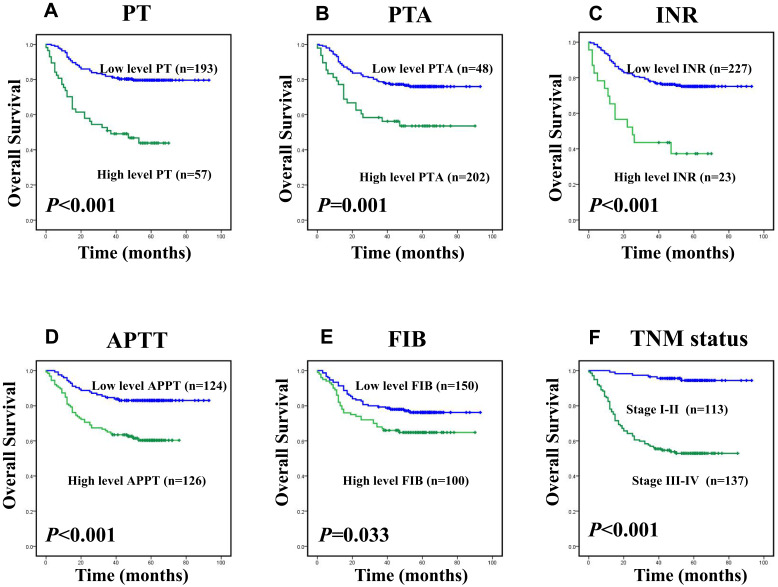
Figure 2.
Kaplan–Meier survival analysis of patients with CRC, overall survival (OS) curves for the patients according to (A) the PT level (low level:<11.85sec, n=193; high level: ≥11.85sec, n=57); (B) the PTA% level (low level:<91.75%, n=48; high level: ≥91.75%, n=202); (C) the INR level (low level:<1.15, n=227; high level: ≥1.15, n=23); (D) the APTT level (low level:<25.85sec, n=124; high level: ≥25.85sec, n=126); (E) the FIB level (low level:<3.245g/L, n=150; high level: ≥3.245g/L, n=100); (F) TNM stage (I–II, n=113; III–IV, n=137).

