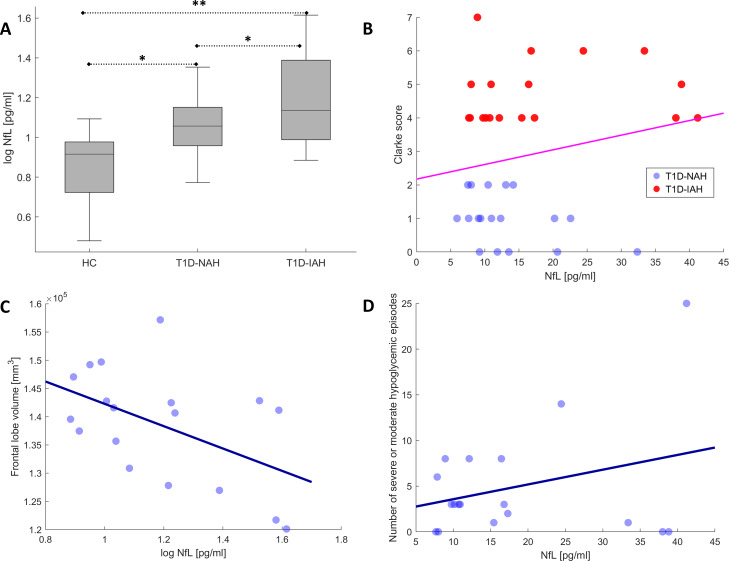
Figure 1.
(A) Plasma NfL differences across groups (*p<0.05, **p<0.005). Scatter plots illustrating a subset of significant associations between NfL levels and (B) Clarke scores in patients with T1D, (C) frontal lobe GMV within the T1D-IAH group, and (D) number of severe or moderate hypoglycemic episodes within the T1D-IAH group. GMV, gray matter volumes; HC, healthy controls; IAH, impaired awareness of hypoglycemia; NAH, normal awareness of hypoglycemia; NfL, neurofilament light chain; T1D, type-1 diabetes.

