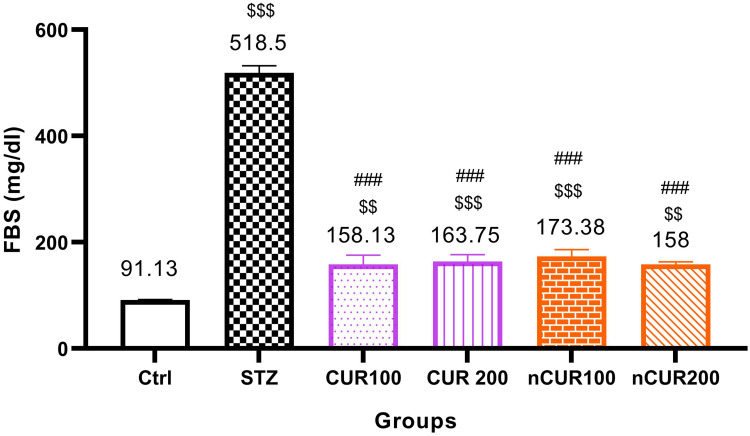
Figure 2.
Effects of curcumin and nano-curcumin on FBS in studied rats. $$$P <0.001 and $$P <0.01 in comparision with control group. ###P <0.001 in comparision with STZ group. Data are expressed as Mean ± SD (n = 8), and analyzed by the One-way ANOVA and Tukey’s post hoc tests.
Abbreviations: Ctrl, control group; STZ, diabetic control group; CUR, curcumin; nCUR, nano-curcumin; FBS, fasting blood sugar.

