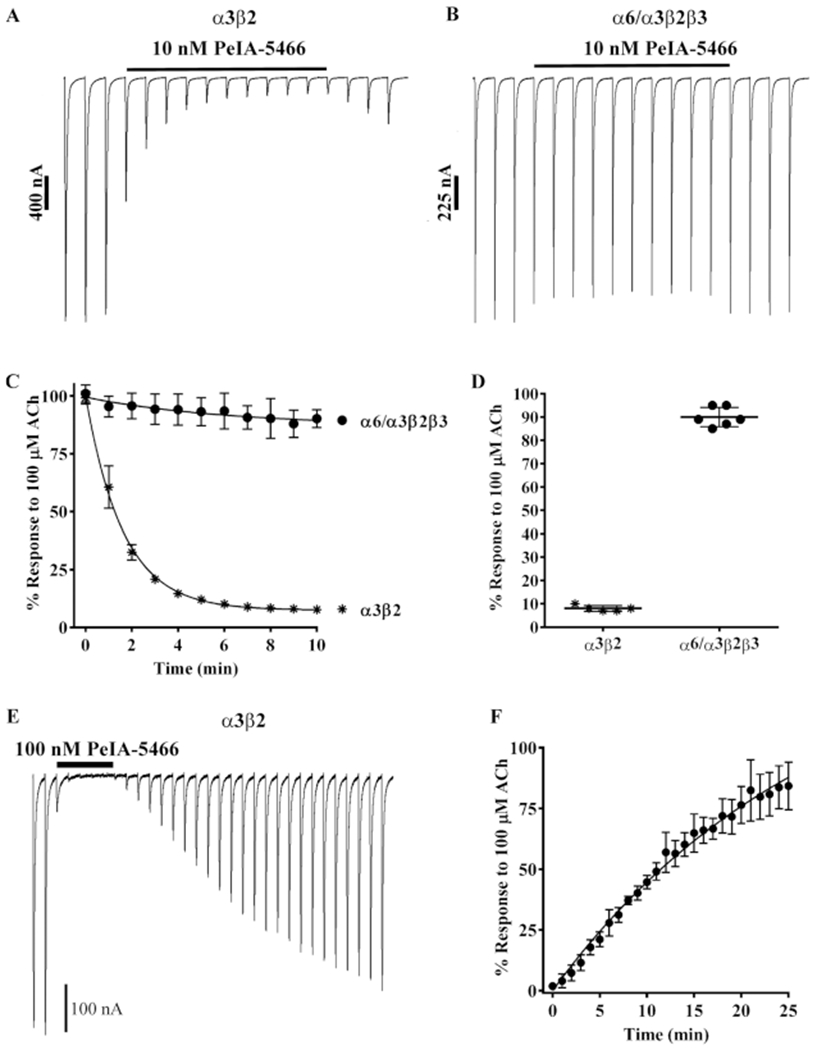
Figure 7.

Kinetic analysis of PeIA-5466 for α3β2 and α6/α3β2β3 nAChRs. Xenopus oocytes expressing α3β2 or α6/α3β2β3 nAChRs were subjected to TEVC electrophysiology as described in Methods. (A) Representative current traces from an oocytes expressing α3β2 nAChRs before, during, and after exposure to 10 nM PeIA-5466. (B) Representative current traces from an oocyte expressing α6/α3β2β3 nAChRs before, during, and after exposure to 10 nM PeIA-5466. (C) The exponential fit of the data for the inhibition of α3β2 nAChRs yielded a kobs of 0.617 ± 0.023 min−1 and a t1/2 of 1.1 (1.0–1.2) min. (C, D) The current amplitudes in the presence of 10 nM PeIA-5466 were inhibited to 8 ± 1% (n = 5, SD) of control values for α3β2 nAChRs and to 90 ± 4% (n = 6, SD) of control values for α6/α3β2β3 nAChRs. (E) Representative current traces from an oocyte expressing α3β2 nAChRs showing the inhibition and recovery kinetics during and after exposure to 100 nM PeIA-5466. The current amplitudes in the presence of 100 nM peptide were inhibited to 2 ± 1% (n = 4, SD) of control values. (F) The exponential fit of the data for recovery from inhibition yielded an observed off-rate constant (koff) of 0.065 ± 0.001 min−1 and a t1/2 for recovery of 10.6 (10.2–11.0) min. The Kd was determined to be 1.18 ± 0.47 nM. The 30 s traces in A, B, and E are shown concatenated omitting the 30 s intersweep interval for brevity. The error bars in (C, D, and F) indicate the SD. The Kd was calculated from Kd = koff/kon where kon = (kobs − koff)/[ligand].
