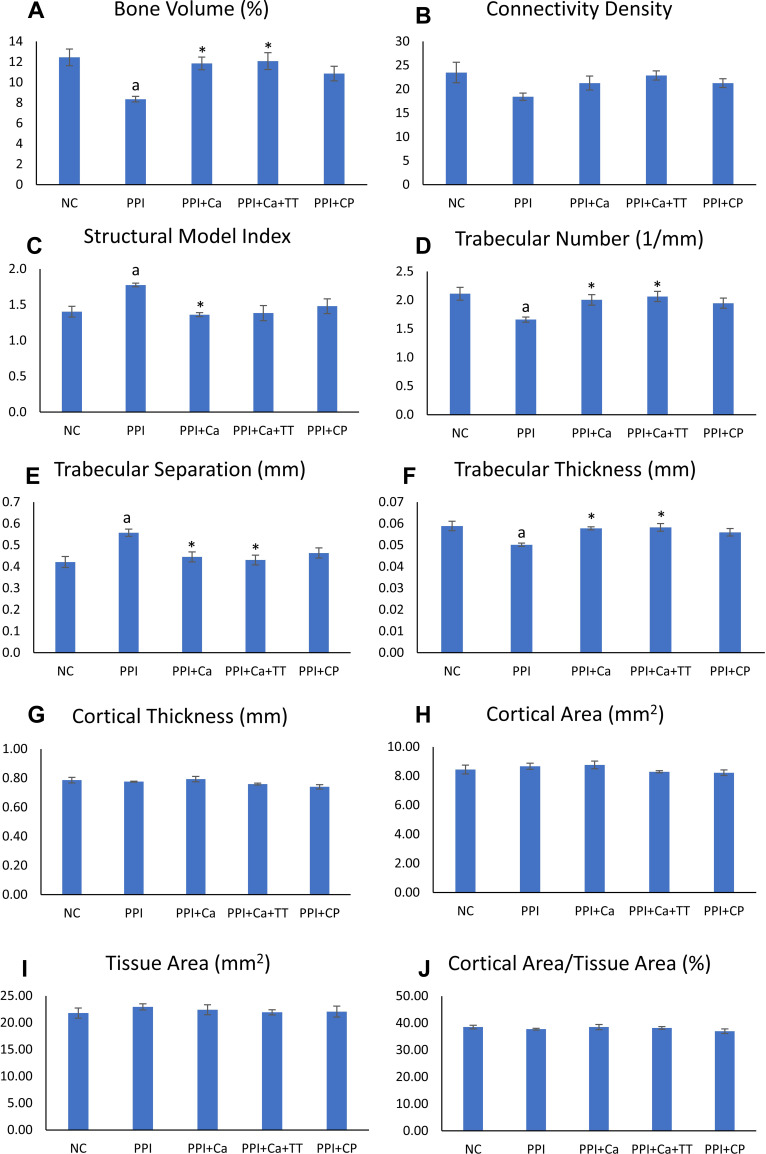
Figure 3.
Trabecular and cortical microstructures of the rats. The trabecular indices evaluated include bone volume (A), connectivity density (B), structural model index (C), trabecular number (D), trabecular separation (E) and trabecular thickness (F). The cortical indices evaluated include cortical thickness (G), cortical area (H), tissue area (I) and cortical area/tissue area (J). Letter aindicates a significant difference compared to the normal control; *indicates a significant difference compared to the PPI group.
Abbreviations: NC, normal control; PPI, pantoprazole/negative control; PPI+Ca, pantoprazole group treated with calcium; PPI+Ca+TT, pantoprazole group treated with calcium and annatto tocotrienol; PPI+CP, pantoprazole group treated with Caltrate Plus.

