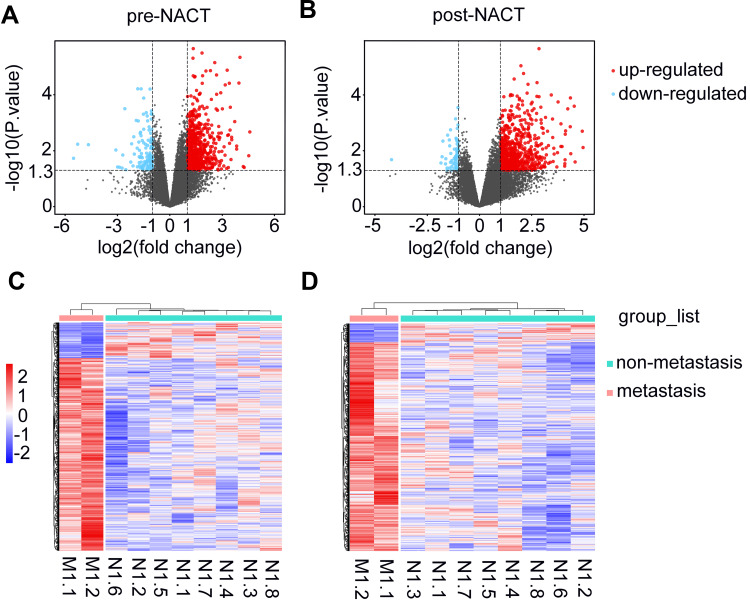
Figure 1.
Comparison of transcriptomic profiles of TNBCs between the metastasis and non-metastasis group. (A and B) Volcano plots of transcripts of TNBCs of metastasis group relative to non-metastasis group at diagnosis (A) or post-NACT (B). Red and blue dots represent up-regulated and down-regulated genes with |log2(fold change)|≥1.0 and p values <0.05, respectively. (C and D) Heat maps with clusters of differentially expressed genes with |log2(fold change)|≥1.0 and p values <0.05 at diagnosis (C) and post-NACT (D).
Abbreviations: M, metastasis; N, non-metastasis; TNBC, triple-negative breast cancer; NACT, neoadjuvant chemotherapy.

