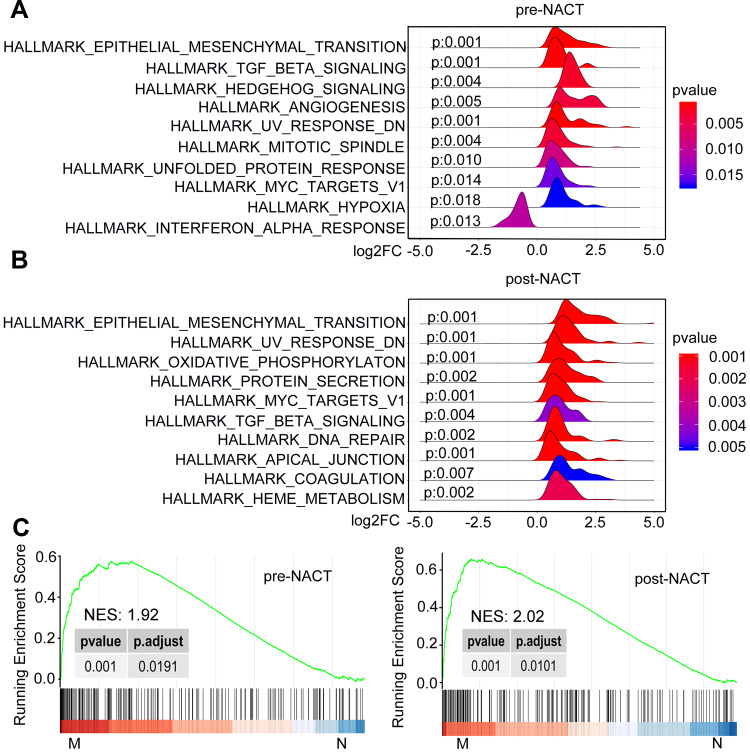
Figure 2.
GSEA plots depicting the enrichment of signal pathways in tumors of the metastasis relative to non-metastasis group. (A and B) Ridgeline plots of the 10 most significantly enriched pathways based on the hallmark gene sets at diagnosis (A) and post-NACT (B). (C) The EMT pathway is positively enriched in tumors of the metastasis group relative to non-metastasis group at diagnosis (left) and post-NACT (right).
Abbreviations: M, metastasis; N, non-metastasis; NES, normalized enrichment score; NACT, neoadjuvant chemotherapy; EMT, epithelial–mesenchymal transition.

