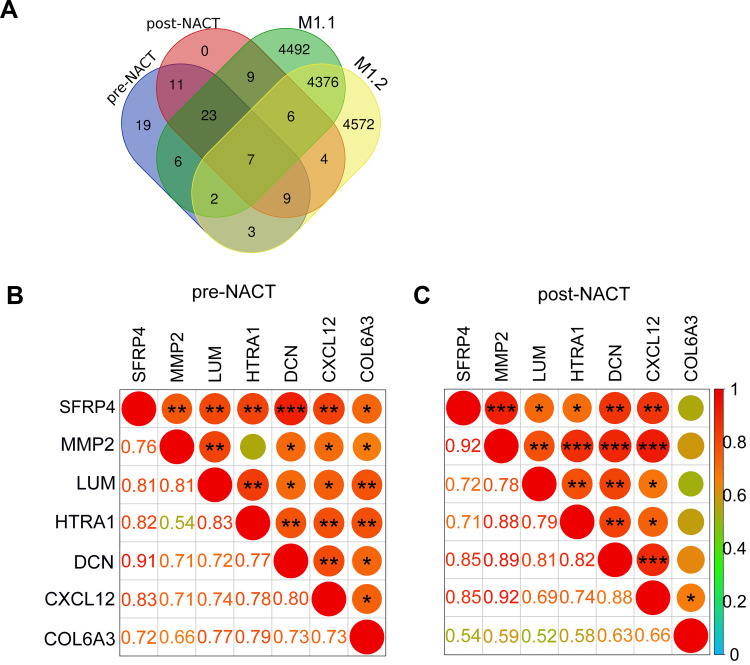
Figure 4.
(A) The Venn diagram displaying the overlaps among the upregulated EMT genes in pre-NACT (purple) and post-NACT (pink) NACT tumors in the metastasis group. The EMT genes that were upregulated in each of the post-NACT compared with pre-NACT tumors in the metastasis group were also depicted (green and yellow). (B and C) Pearson correlation matrices describing the relationships among the indicated 7 genes in paired tumors pre- (B) and post-NACT (C). The Pearson ρ coefficients were exhibited in various size of circles as well as the shade of colors. Numbers represent the exact values of coefficients. *P<0.05; **P <0.01; ***P <0.001.
Abbreviations: M, metastasis; EMT, epithelial–mesenchymal transition; NACT, neoadjuvant chemotherapy.

