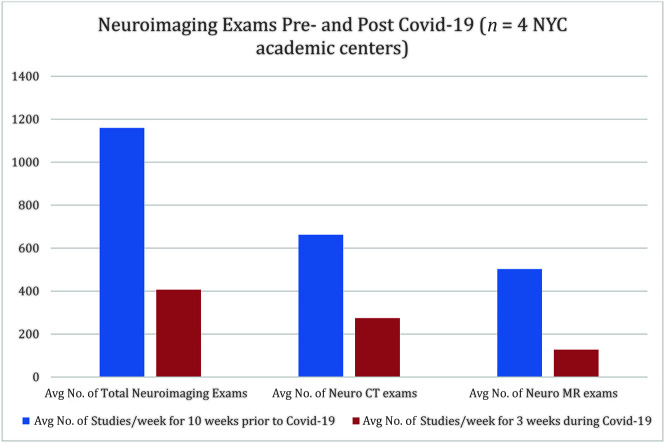
Fig 1.
Chart demonstrates changes in the weekly average (Avg) of the total number of neuroimaging cases as well as changes in the weekly average of the total number of neurologic CT and MR imaging examinations. This compares weekly average volumes for 10 weeks before the NYC official shutdown to the 3 weeks following the shutdown at the height of the NYC pandemic.

