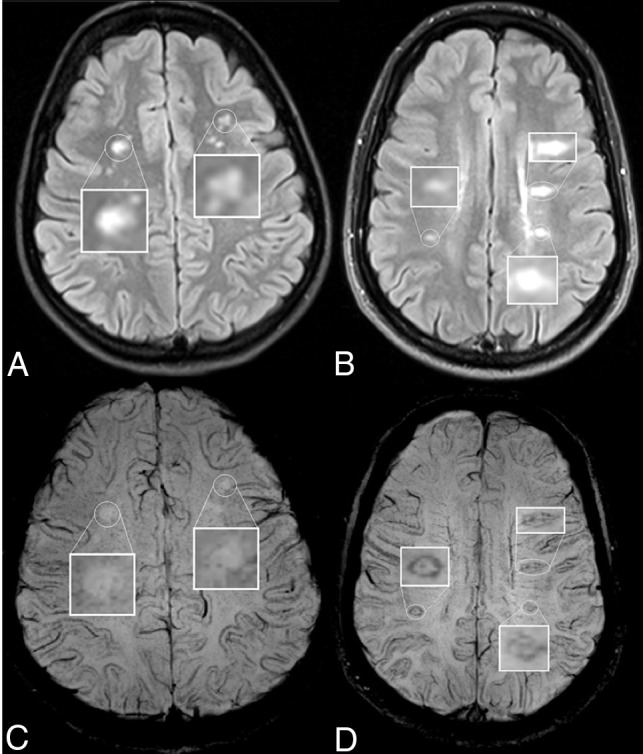
Fig 2.

Lesion appearance on axial T2-FLAIR (upper row) and the corresponding susceptibility-weighted (lower row) images in patients with Sjögren disease (A and C) and MS (B and D). The patient with Sjögren disease has no visible CVs or IRs on the SWI. The patient with MS has clearly visible IRs, which correspond to the lesion edges visible on the T2-FLAIR. CVs are also visible inside the lesions as hypointense dots or lines.
