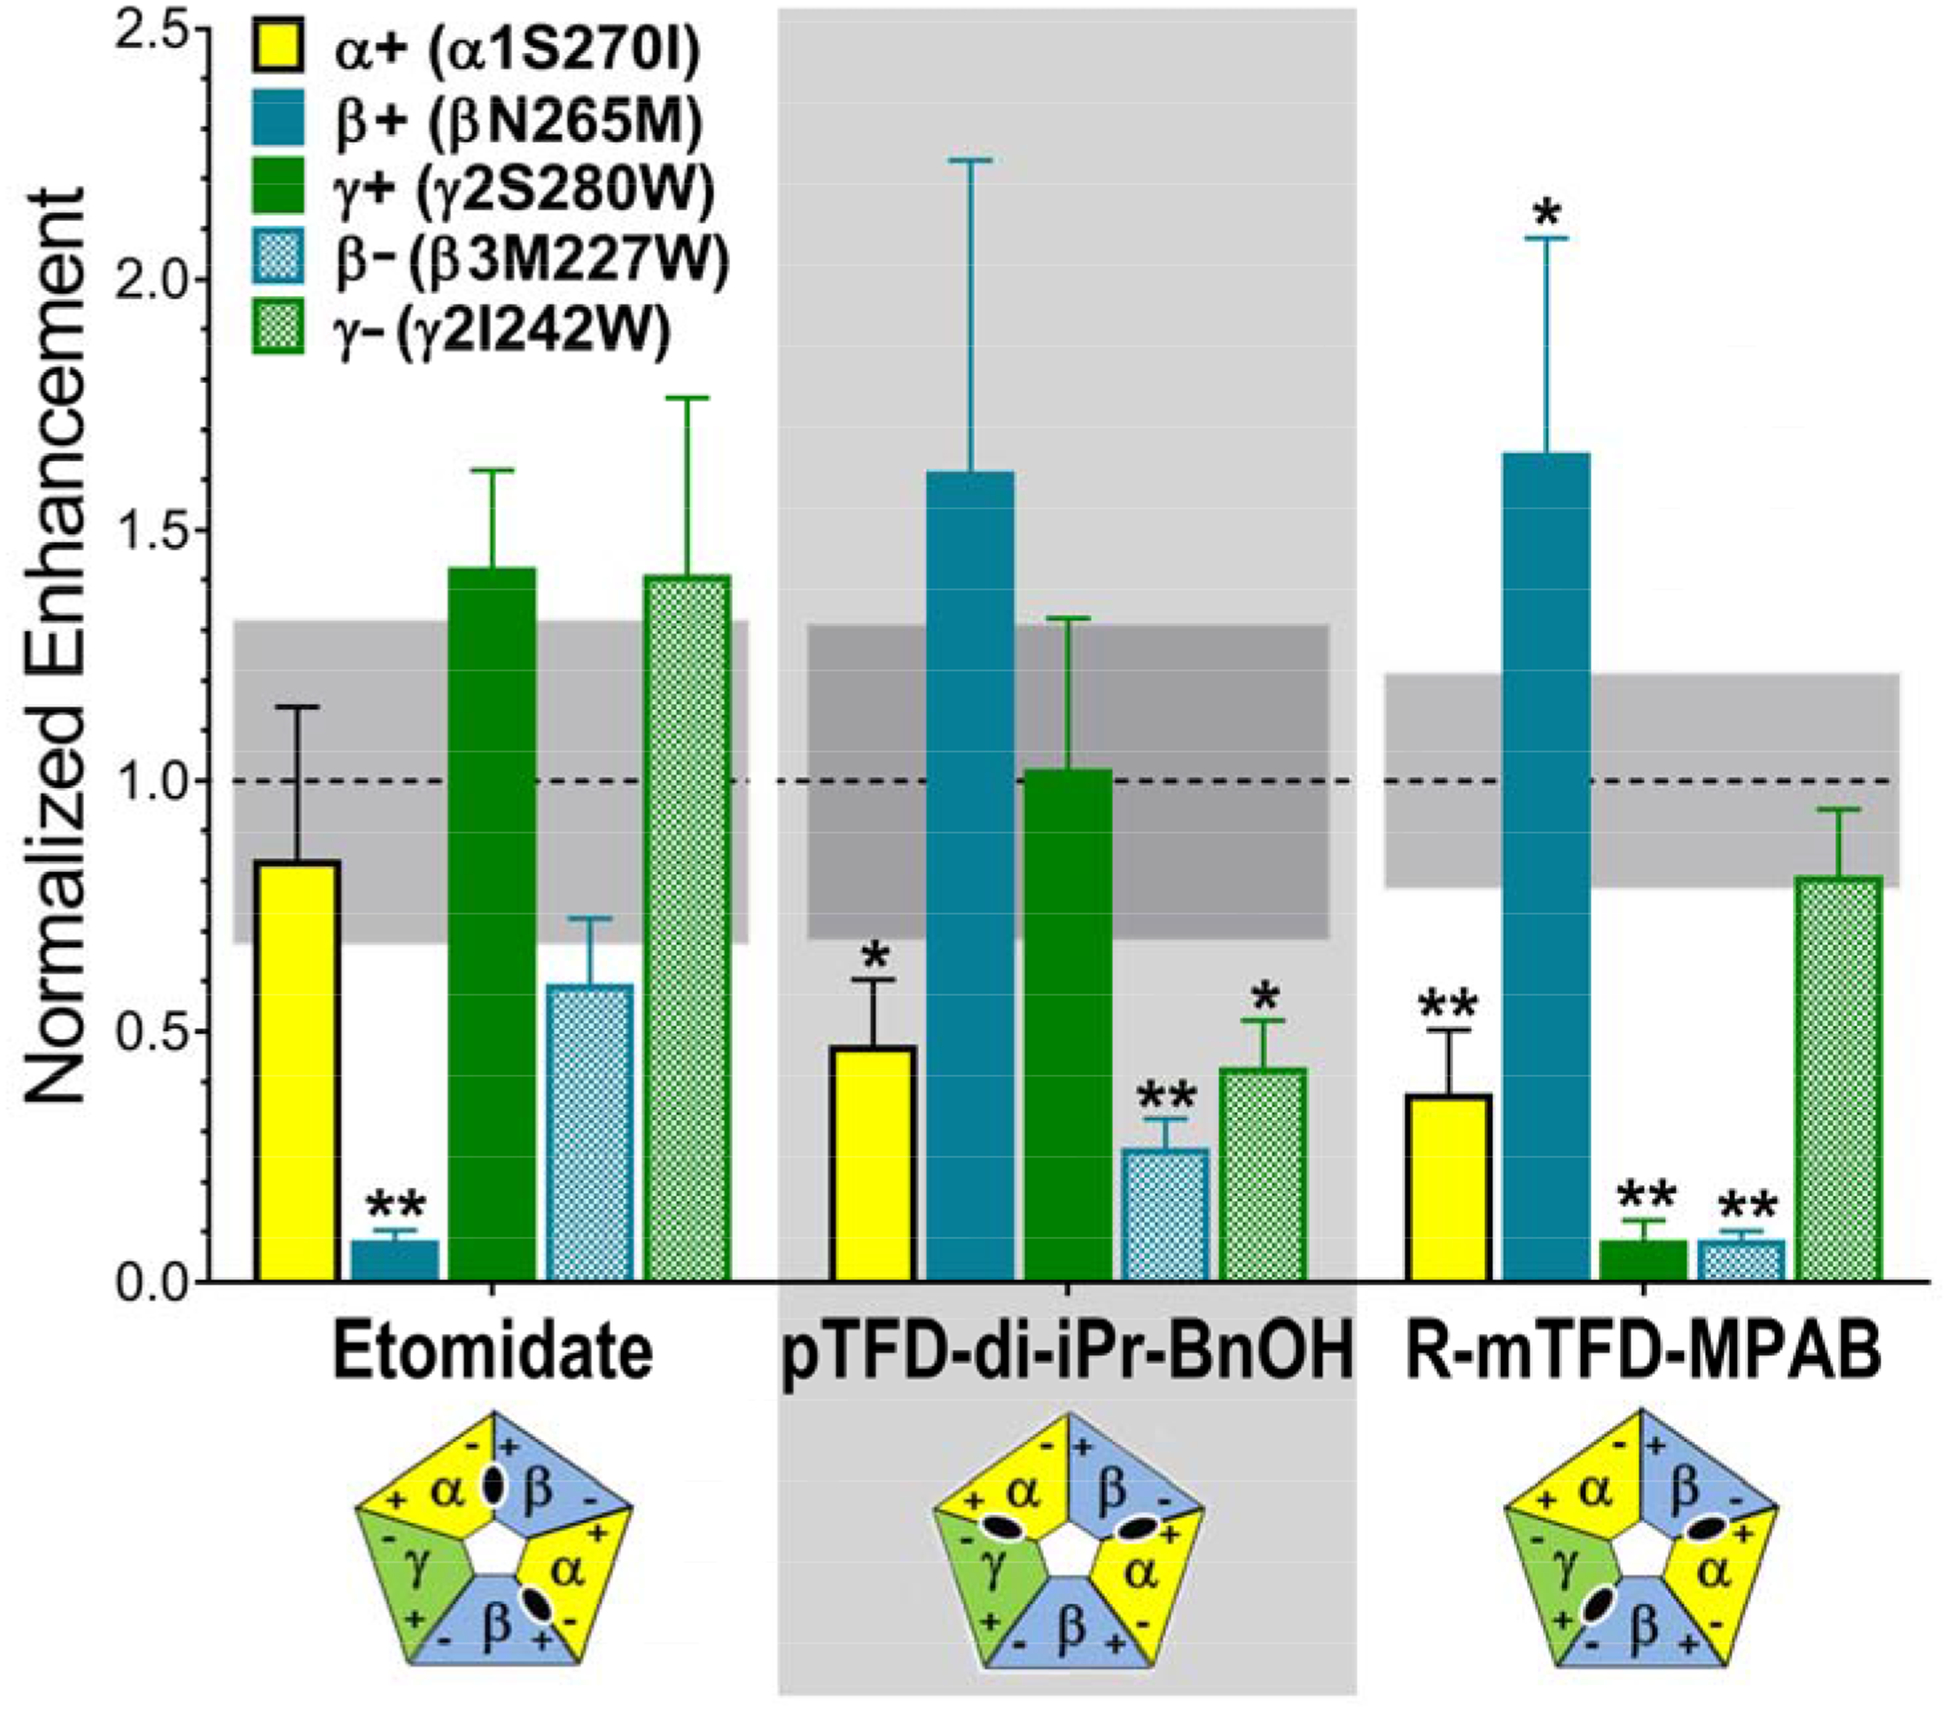
Figure 4. Drug-dependent normalized enhancement patterns in α1β3γ2L GABAA receptors with mutations in the M1 or M2 transmembrane domain helices.

Drug enhancement ratios from experiments summarized in Figure 3 were normalized to average drug-specific enhancement ratios in wild-type receptors (see Figure 3, panel A). Normalized ratios are displayed as bars (mean ± SD), colored by mutation (M2 15’ mutants: α1 S270I = yellow; β3 N265M = solid blue; γ2 S280W = solid green. M1 11’ mutants: β3 M227W = checkered blue; γ2 I242W = checkered green). Combined mean ± SD values for normalized wild-type enhancement were: for etomidate, 1.0 ± 0.32 (n =9); for pTFD-di-iPr-BnOH, 1.0 ± 0.30 (n = 9), and for R-mTFD-MPAB, 1.0 ± 0.17 (n =8). The 95% confidence intervals of the wild type mean is shown as a gray band. Data were analyzed using two-way ANOVA and P-values (mutant vs. wild-type) were calculated with Student’s t-tests (* P < 0.01; ** P < 0.001). A significance threshold of P < 0.01 was based on the Bonferroni correction for 5 mutant comparisons to each wild-type data set for a given drug. Results where significant reductions in drug enhancement relative to wild-type are found indicate the following drug-residue contacts: etomidate binds near β3 N265; pTFD-di-iPr-BnOH binds near α1 S270, β3 M227 and γ2 I242; and R–mTFD-MPAB binds near α1 S270, γ2 S280; and β3 M227. The diagrams below each drug name depict the established subunit arrangement for αβγ GABAA receptors with subunits colored α =yellow; β = blue; and γ = green, and with + and − faces labeled. The inferred transmembrane inter-subunit sites occupied by each drug are shown in the corresponding diagrams as black ovals.
