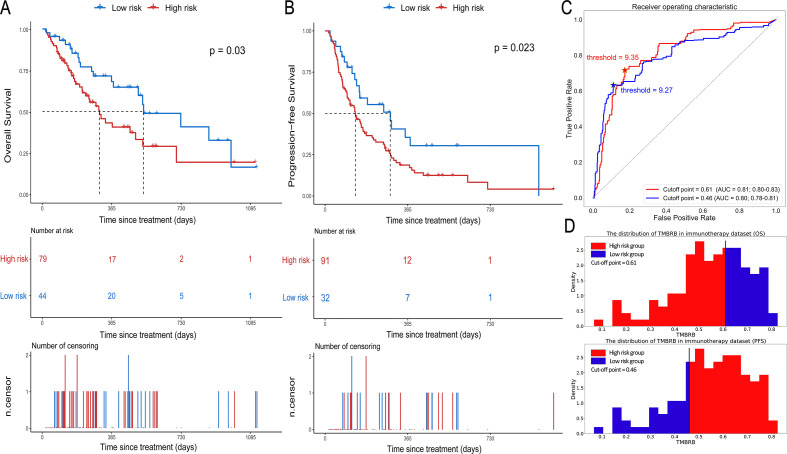
Figure 3.
Prognostic value of TMBRB in immunotherapy. (A) and (B) The Kaplan-Meier curves depicting OS in high- and low-risk groups of OS and the high- and low-risk groups of PFS. (C) The receiver operating curves for TMB to distinguish between high- and low-risk groups and its best cut-off points (OS: 0.61; PFS: 0.46), which reflects the most likely cut-off points of TMB to be used for risk stratification (OS: 9.35; PFS: 9.27). (D) The distribution of TMBRB in immunotherapy data set, and the best cut-off points of TMBRB for OS and PFS. AUC, area under the curve; OS, overall survival; PFS, progression-free survival; TMBRB, tumor mutational burden radiomic biomarker.

