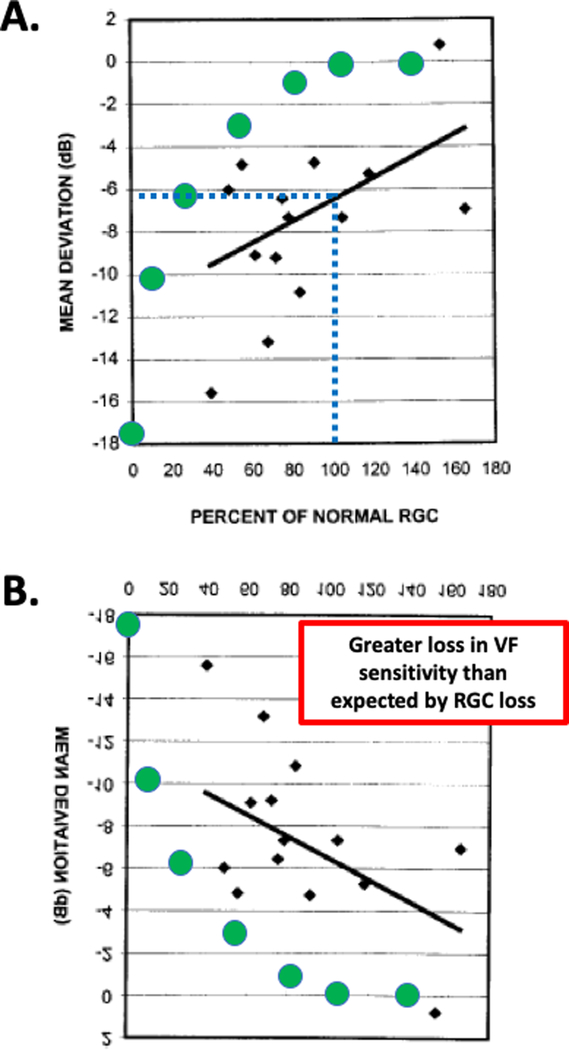
Figure 2.
Figure is modified from Fig. 3 of Kerrigan-Baumrind et al.3 For 17 post-mortem eyes, mean deviation loss in sensitivity on SAP is shown versus the average percentage of normal retinal ganglion cells (RGC) remaining for each eye. A. The dotted blue line indicates that according to the regression line, a 6 dB loss in MD is associated with a normal (100%) complement of RGCs. The green symbols are the prediction of a linear model relating sensitivity loss to loss in RGCs.6 The points falling below the green symbols indicate a greater loss in VF sensitivity than expected by RGC loss. B. Same as in panel A, but rotated to agree with the orientation of Fig. 1.

