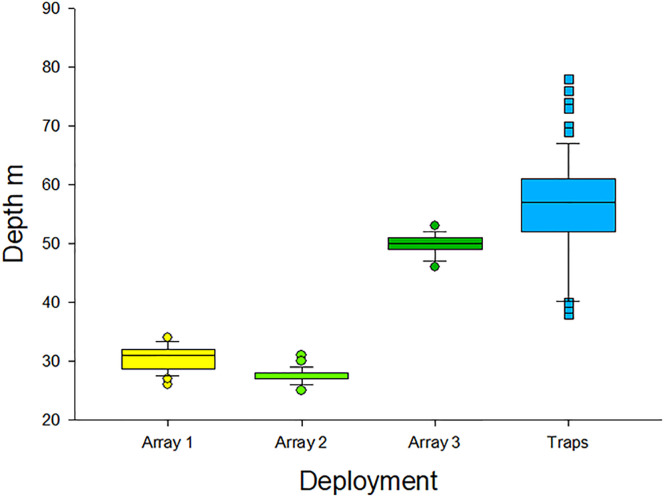
Fig 5. Summary of telemetry base and fish trap deployments.
Box plots of depth distributions for acoustic receiver array (n = 3) deployments (n = 25, 120, and 112 individual receiver base deployments, respectively) and experimental lionfish trapping (n = 300 trap sets) in the northern Gulf of Mexico. The horizontal line inside each box indicates the median, while lower and upper sides indicate the 25th and 75th percentiles and extended bars indicate 5th and 95th percentiles. Symbols indicate acoustic receiver base deployments or traps sets that were beyond the 5th or 95th percentiles of the respective depth distributions.

