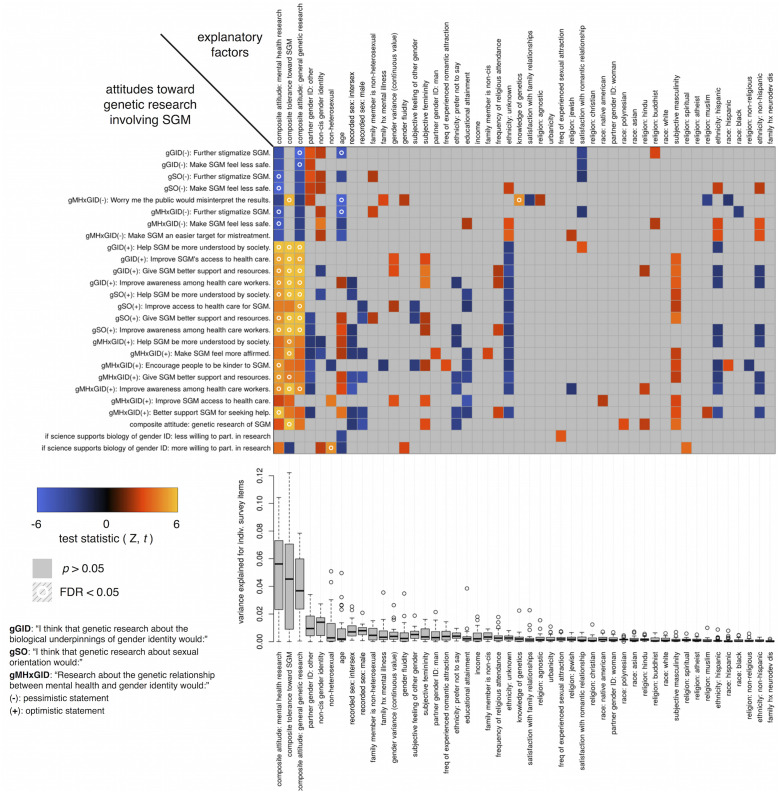
Fig 1. Survey items relation to genetic attitudes.
The statistical associations between survey items related to attitudes toward genetic research involving SGM (rows) and explanatory factors (columns). Explanatory factors (columns) are ordered by the mean variance explained (boxplots below) over the considered survey items. Negative associations are in blue, positive associations are in orange, and non-significant associations are in gray. Boxes with a circle represent associations that survive multiple testing correction. A table of the top panel full Z-statistics is available in S2 File.

