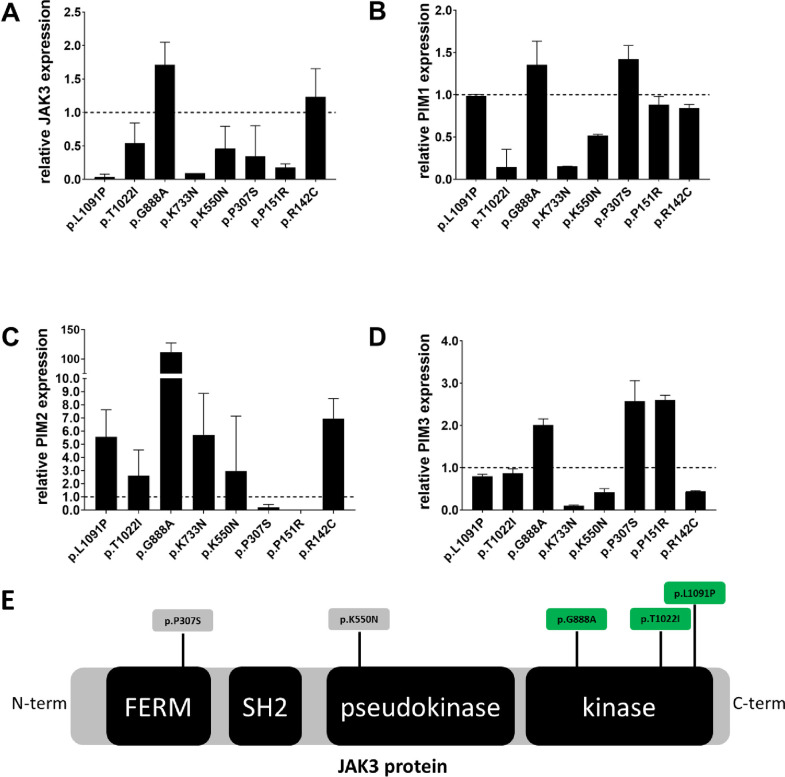
Fig 3.
A-D: Relative mRNA levels of JAK3 (A), PIM1 (B), PIM2 (C) and PIM3 (D) in patient tumor samples with JAK3 mutations (p.L1091P, p.T1022I, p.G888A, p.K733N, p.K550N, p.P307S, p.P151R, p.R142C). Histograms represent the relative abundance of JAK3 (A), PIM1 (B), PIM2 (C) and PIM3 (D) mRNA in mutated samples compared to their averaged relative mRNA level in four patient tumor samples without JAK3 mutations (i.e. control samples, PT-102, PT-101, PT-109, PT-123). Dotted black line at y = 1.0, represents the reference control expression level against which the expression fold-change of the mutant samples is calculated. Error bar on the histogram denotes the standard deviation. Tumor samples carry the following mutations: PT_111 = p.L1091P (validated somatic), PT_049 = p.T1022I (validated somatic), PT_024 = p.G888A (validated somatic), PT_020 = p.K733N (validation failed), PT_095 = p.K550N (validated somatic), PT_151 = p.P307S (validated somatic), PT_130 = p.P151R (validated germline), PT_070 = p.R142C (not validated). E: Schematic representation of JAK3 protein and its main domains: the four-point-one, Ezrin, Radixin, Moesin (FERM) domain; the Src homology-2 (SH2) domain; and the pseudo kinase and kinase domains. Somatic mutations identified in this study are shown p.G888A, p.T1022I, p.L1091P, p.K550N, p.P307S. Highlighted in green are the mutations functionally assessed in this study. C-term = carboxyl-terminus domain, N-term = amino-terminus domain.

