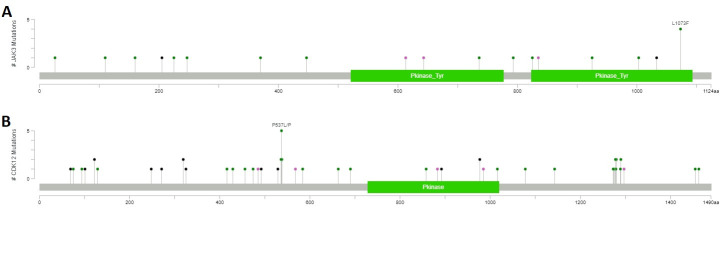
Fig 6.
Mutation maps of JAK3 (A) and CDK12 (B) proteins. Diagram circles (“lollipop plots”) represent the variants found in JAK3 and CDK12 genes in the validation series of 463 ovarian samples. The circles are colored with respect to the corresponding mutation types: green = Missense mutations, black = Truncating mutations (Nonsense, Frameshift insertion/deletion), purple = Other types of mutations. The x-axis report the amino acid number, the y-axis reports the frequency of the mutation. Mutation maps were generated using the MutationMapper tool from the cBioPortal database.

