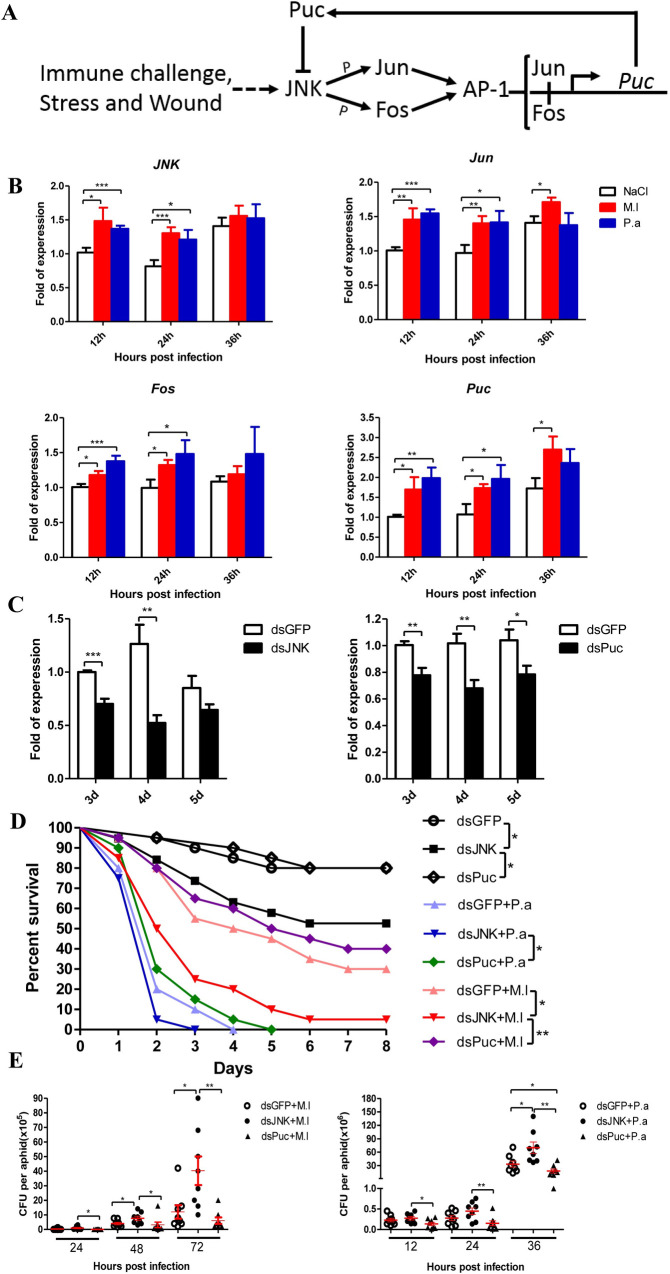
Fig 1. JNK pathway contributes to the pea aphid’s immune defense against bacterial infection.
(A) The JNK signaling cascade of pea aphid based on functional studies from Drosophila melanogaster and Anopheles gambiae. (B) Relative expression levels of JNK, Jun, Fos and Puc in the pea aphids after Gram-positive bacteria M. luteus (M.l) and Gram-negative bacteria P. aeruginosa (P.a) infections with the aphids injected by sterile 0.85% as control groups. The expressions of JNK, Jun, Fos and Puc were normalized with ribosomal protein L7 gene (rpl7) of the pea aphids, and the relative expression of the infection groups were compared to the expression of the control groups at each time point. (C) Efficiency of RNA interference-mediated knockdown of the pea aphid JNK and Puc. The expressions of JNK and Puc were normalized with rpl7 of the pea aphids, and the relative expression of the dsJNK and dsPuc injected groups were compared to the expression of the dsGFP groups at each time point. (D) Effect of JNK and Puc silence on the survival of the pea aphids after M. luteus (M.l) and P. aeruginosa (P.a) infection, n = 20. One representative survival graph from three independent experiments with similar results is shown. The statistical differences between the compared groups were denoted with asterisks. The log-rank (Mantel-Cox) test was used to analyze the pea aphids’ survival curves. *P<0.05; **P<0.01. (E) Effect of JNK and Puc silence on the bacteria loads of the pea aphids after M. luteus (M.l) and P. aeruginosa (P.a) infection, n = 8. Each dot in the graph represents an individual aphid. The horizontal bars indicate mean values and the vertical bars indicate the SEM of the replicates. The statistical differences between the compared groups were denoted with asterisks. P values were determined by Student’s t test. *P<0.05; **P<0.01. For (A) and (B), values shown are the mean (±SEM) of three independent experiments. The statistical differences between the control groups and infection groups were denoted with asterisks (A). The statistical differences between the dsGFP injected groups and dsJNK or dsPuc injected groups were denoted with asterisks (B). P values were determined by Student’s t test. *P<0.05; **P<0.01; ***P<0.001.

