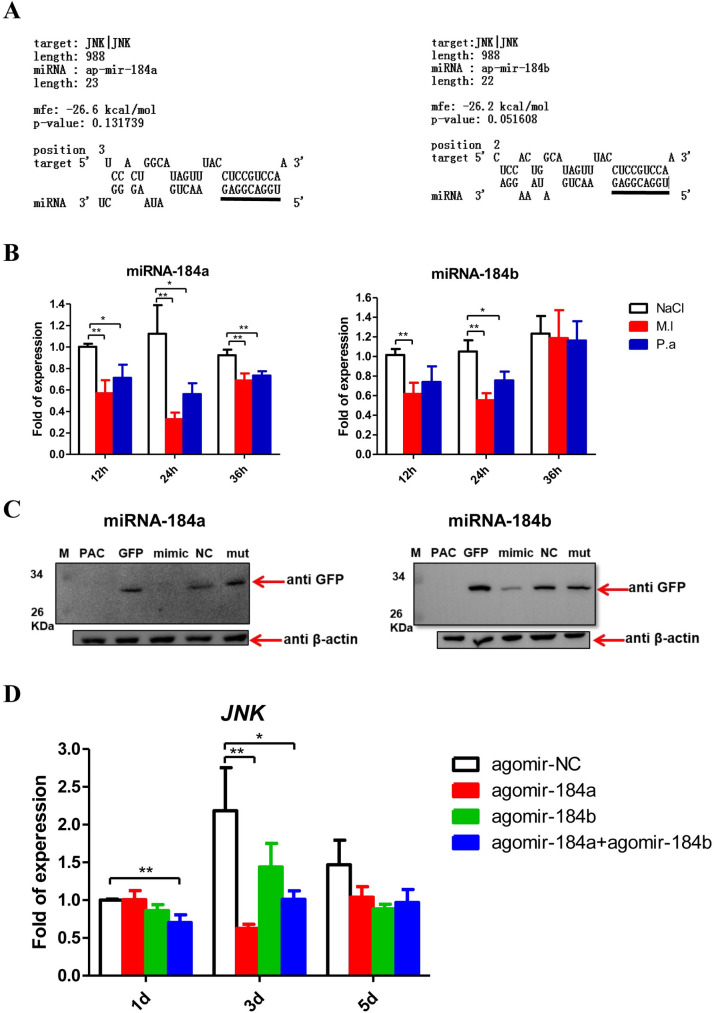
Fig 5. miR-184a/b target and negatively regulate JNK.
(A) The putative miR-184a and miR-184b target binding site in 3′ UTR of JNK is predicted by using RNAhybrid. The sequences in the lines above were seed region (5′GGACGGA3′) binding sites predicted. (B) Relative expression levels of miR-184a and miR-184b in the pea aphids after M. luteus (M.l) and P. aeruginosa (P.a) infections with the aphids injected by sterile 0.85% as control groups. The expressions of miR-184a and miR-184b were normalized with U6 snRNA of the pea aphids, and the relative expression of the infection groups were compared to the expression of the control groups at each time point. (C) Western blotting of the GFP reporter assays showed that miR-184a and miR-184b directly degrade the 3′UTR of JNK in vitro. The upper arrows point to GFP reporter and the loading control β-actin was pointed by the nether arrows. M: Marker; PAC: pAc-5.1/V5-HisB plasmid was transfected into S2 cells alone, as mock or negative control; GFP: pAc-5.1/V5-HisB-GFP-JNK 3′UTR reporter plasmid was transfected into S2 cells alone, as positive control; mimic: pAc-5.1/V5-HisB-GFP-JNK 3′UTR reporter plasmid and mimic of miR-184a or miR-184b were co-transfected into S2 cells; NC: pAc-5.1/V5-HisB-GFP-JNK 3′UTR reporter plasmid and negative control mimic were co-transfected into S2 cells; mut: mutant mimic of miR-184a or miR-184b (at seed region: 5′-GGACGGA-3′ mutated as 5′-GACAUUC-3′) and pAc-5.1/V5-HisB-GFP-JNK 3′UTR reporter plasmid were co-transfected into S2 cells. (D) Relative expression levels of JNK in pea aphids after injected agomir-184a, agomir-184b and half-dose of agomir-184a plus half-dose of agomir-184b, with the aphids injected with agomir-NC as control group. The expressions of JNK were normalized with rpl7 of the pea aphids, and the relative expression of the agomir-184 groups were compared to the expression of the control groups at each time point. For (B) and (D), the values shown are the mean (±SEM) of three independent experiments and the statistical differences between the compared groups were denoted with asterisks. P values were determined by Student’s t test. *P<0.05; **P<0.01.

