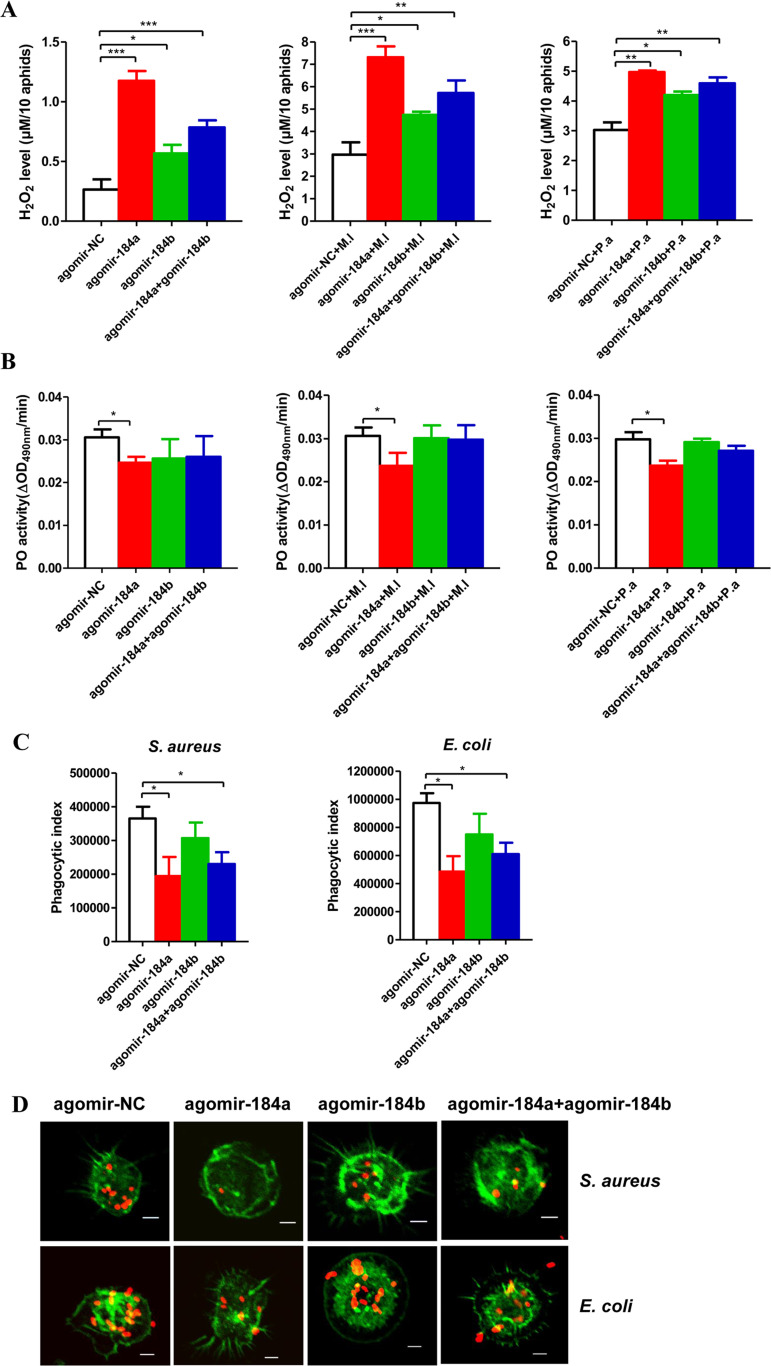
Fig 6. miR-184a/b regulate ROS metabolism, PO activity and hemocytes phagocytosis.
Effect of injection of agomir-184a, agomir-184b and half-dose agomir-184a plus half-dose agomir-184b on H2O2 concentration (A) and the PO activity (B) in the aphids uninfected and infected by M. luteus (M.l) and P. aeruginosa (P.a) and the hemocytes phagocytosis (C-D). Ten aphids for the sample per group at each time point were used for the measurements of H2O2 concentration. Twenty aphids for the sample per group at each time point were used for measurements of PO activity. The hemocytes from 20 pea aphids per group were used to perform each experiment. For (A-C), the values shown are the mean (±SEM) of three independent experiments and the statistical differences between the compared groups were denoted with asterisks. P-values were determined by Student’s t test. *P<0.05; **P<0.01; ***P<0.001. (D) The photographs of ex vivo phagocytosis S. aureus and E. coli AlexaFluo 594 BioParticle (Invitrogen) by the hemocytes with the F-actin stained by SF-488 Phalloidin (1/200 diluted, Solarbio) after injection of agomir-184a, agomir-184b and half-dose agomir-184a plus half-dose agomir-184b. The red dots were S. aureus and E. coli, and the green parts were the hemocytes with the F-actin stained. Scale bar: 5 μm.

